dss_2024
Secondary chromosome duplication in bacteria
Featured scientist
Research Background
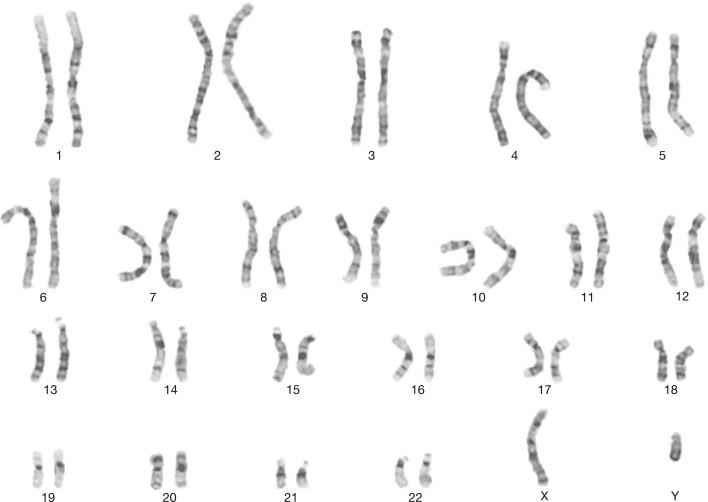
The structure of DNA in unique in bacteria compared to animals. Humans have 46 chromosomes, which come in 23 pairs and are arranged as strands.
Bacteria have a single primary chromosome, which is arranged in a circle. This chromosome contains most of the necessary (core) genes for survival and reproduction. However, bacteria also have two other DNA structures- plasmids and a secondary chromosome.
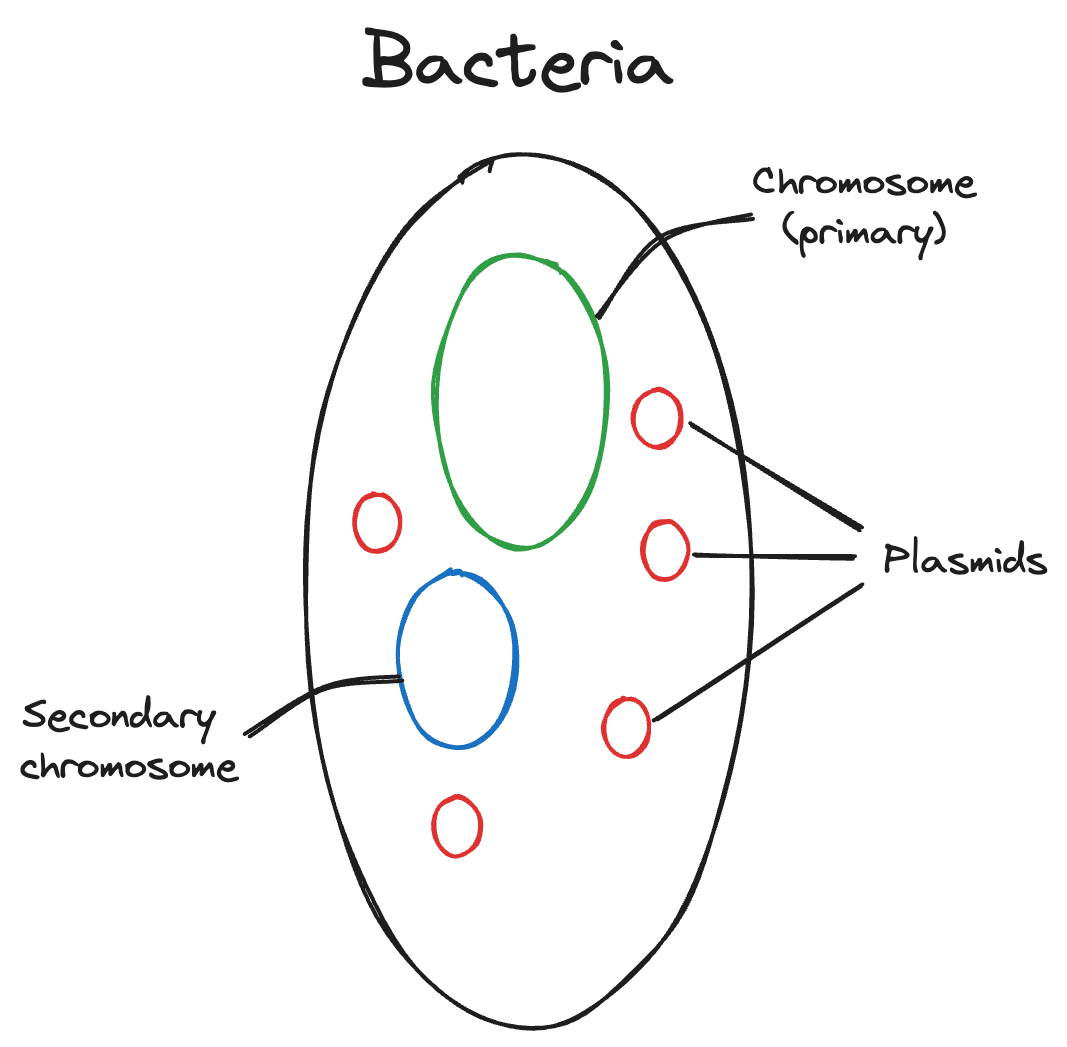
Plasmids are smaller than the chromosomes, and contain genes that help the bacteria adapt to different environments, but are not core genes. There can be more than one in a bacterium. Secondary chromosomes are unique because they contain features of both the primary chromosome and plasmids. They contain core genes along with other genes that aid in adaptability, and there can only be one in a bacterium. The precise mechanisms by which secondary chromosomes replicate and mutate influence bacterial adaptation. Understanding these mechanisms can aid in preventing disease due to bacterial adaptation to antibiotics and other drugs.
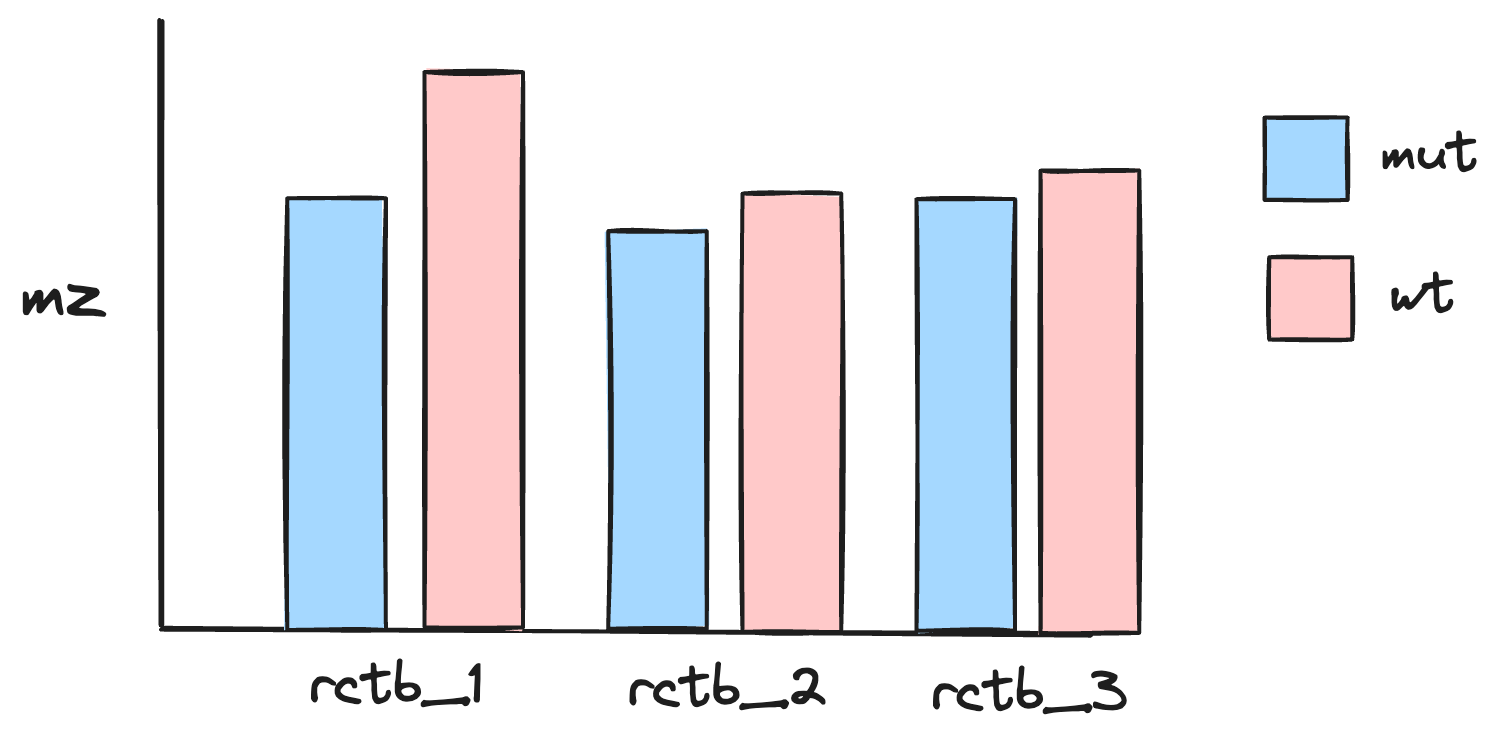
For these reasons, Dr. David Jeruzalmi and colleagues sought to understand the structure of the protein that initiates secondary chromosome replication in the cholera pathogen Vibrio cholera Orlova et al. (2017). If they can describe the initiator protein’s structure, scientists can more accurately understand how cholera and other pathogenic bacteria adapt. The authors think that the initiator protein, called RctB, of the secondary chromosome may either be more similar to RctB in the primary chromosome or to RctB in the plasmid. They uncover the structure of the secondary chromosome’s RctB using a variety of biochemistry methods. One method they use is to disrupt the protein’s structure by mutating a gene, then measuring the mass-to-charge ratio (m/z) of different domains (i.e. regions) of the protein with the mutation and the protein domains without the mutation (wild type). If the secondary chromosome’s RctB is closer in structure to the plasmid’s RctB, then the authors expect the mutated protein domains to have a lower m/z than the wild type protein. If the secondary chromosome’s RctB is closer in structure to the primary chromosome’s RctB, then the authors expect there to be no difference in m/z between the mutated and wild type protein domains. Dr. Jeruzalmi and colleagues conducted the experiment across three protein domains, recording the m/z for mutants and wild type variants of the protein domains.
Scientific Question
What is the structure of the protein that initiates secondary chromosome replication in the cholera pathogen Vibrio cholera? (You do not have to answer this).
Hypotheses
H1: If the secondary chromosome’s RctB is closer in structure to the plasmid’s RctB, then the authors expect the mutated protein domains to have a lower m/z than the wild type protein.
H2: If the secondary chromosome’s RctB is closer in structure to the primary chromosome’s RctB, then the authors expect there to be no difference in m/z between the mutated and wild type protein domains.
Scientific Data
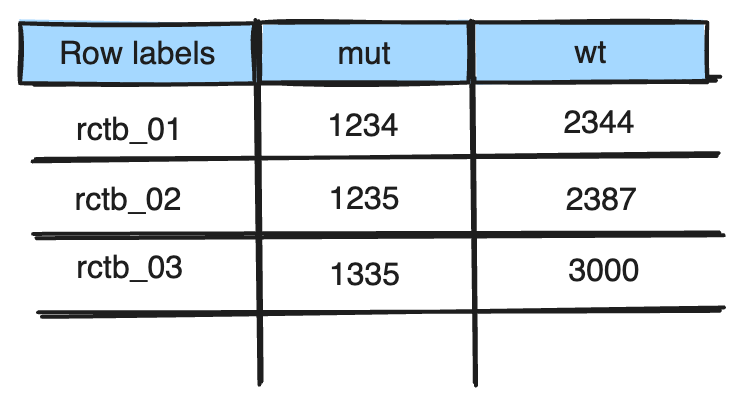
| rctb_ID | variant_class | mz |
|---|---|---|
| rctb_01 | mut | 4236 |
| rctb_01 | mut | 4390 |
| rctb_01 | mut | 3939 |
| rctb_01 | mut | 4278 |
| rctb_01 | mut | 3512 |
| rctb_01 | wt | 5060 |
| rctb_01 | wt | 5964 |
| rctb_01 | wt | 4941 |
| rctb_01 | wt | 5409 |
| rctb_01 | wt | 5952 |
| rctb_02 | mut | 4745 |
| rctb_02 | mut | 4143 |
| rctb_02 | mut | 3957 |
| rctb_02 | mut | 3837 |
| rctb_02 | mut | 3235 |
| rctb_02 | wt | 5050 |
| rctb_02 | wt | 5084 |
| rctb_02 | wt | 4995 |
| rctb_02 | wt | 5227 |
| rctb_02 | wt | 5684 |
| rctb_03 | mut | 3657 |
| rctb_03 | mut | 3324 |
| rctb_03 | mut | 3351 |
| rctb_03 | mut | 3700 |
| rctb_03 | mut | 3343 |
| rctb_03 | wt | 4944 |
| rctb_03 | wt | 4219 |
| rctb_03 | wt | 4611 |
| rctb_03 | wt | 4446 |
| rctb_03 | wt | 4535 |
Table 1. A subset of the data used in the study. The ‘rctb_id’ column is an identification code assigned to each protein domain. The ‘variant_class’ column indicates whether the protein domain was a wildtype (wt) or had the mutant (mut). The ‘mz’ column is the mass-to-charge ratio of the protein domain.
- What are the two treatment groups?
Pivot tables in Excel
A pivot table (called a PivotTable in Excel) is a powerful data analysis tool to summarize large data sets and answer questions about the data. It streamlines the process of selecting, filtering, summarizing, and formatting data into easily interpretable tables and graphs. In short, pivot tables are
-
Simple: Pivot tables are easy to create using drag-and-drop tools without the need for complex formulas
-
Fast: They are time-efficient and allow for quick rearrangement of data display to meet specific needs
-
Flexible: Users can transform columns into rows, group data by any field, and perform advanced calculations easily
To create a PivotTable in Excel, follow these steps:
If you would like to follow along, download the Excel workbook from this link. You might recognize it!
-
Prepare Your Data:
- Ensure your data is well-organized with clear headings and no blank rows or columns.
-
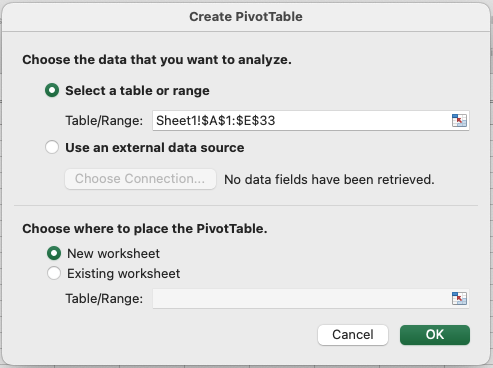
Insert a PivotTable:
- Select your data range.
- Go to the “Insert” tab and click on “PivotTable.”

- Choose where to place the PivotTable.
- Design Your PivotTable:
-
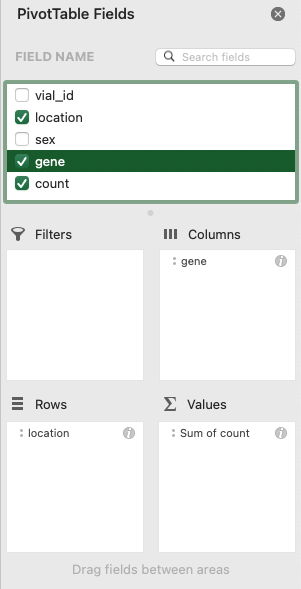
Drag fields like names, IDs, dates, or numbers into the Rows, Columns, and Values areas.
-
For example, to get the number of flies that survived in space versus on Earth (“ground”) according to their genotype (“gene”), you can drag the location field to the Rows, gene field to the Columns, and count field to the Values.
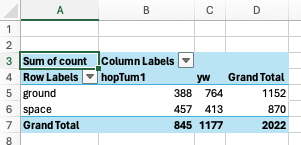
Your PivotTable should look like this:
- Customize Your PivotTable:
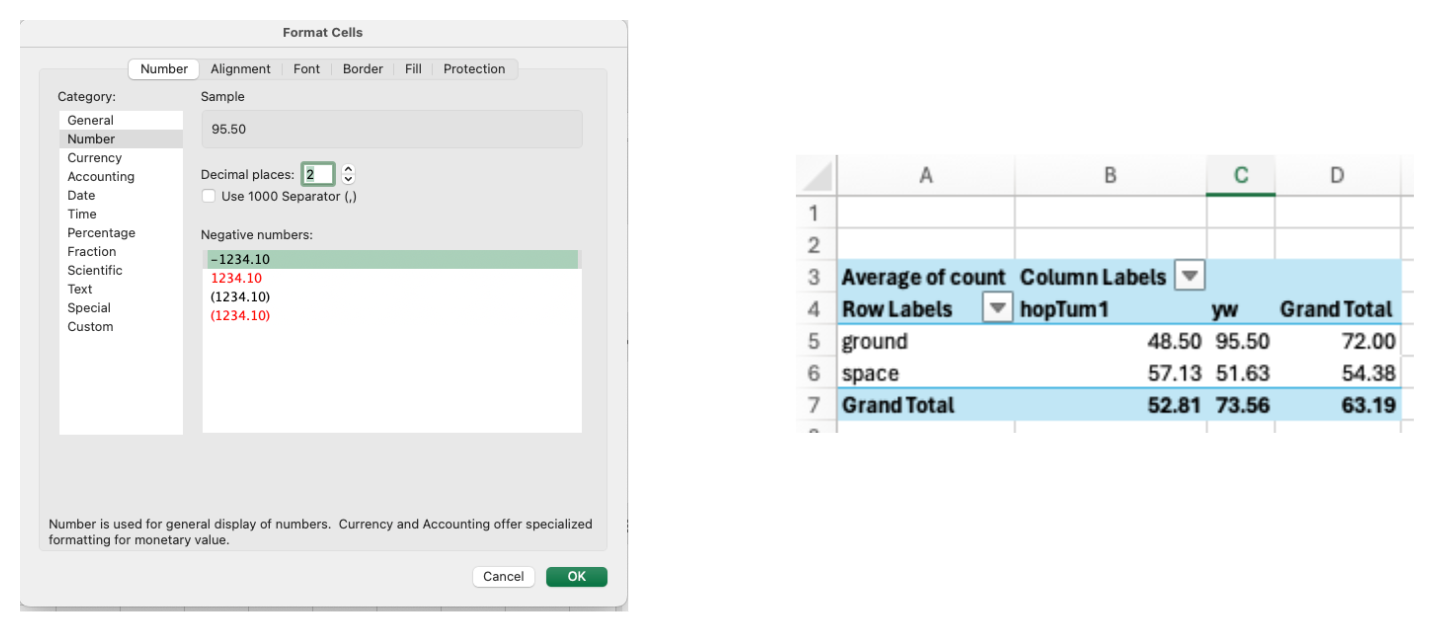
- Right-click on Values in the PivotTable to change calculations like sum or average.
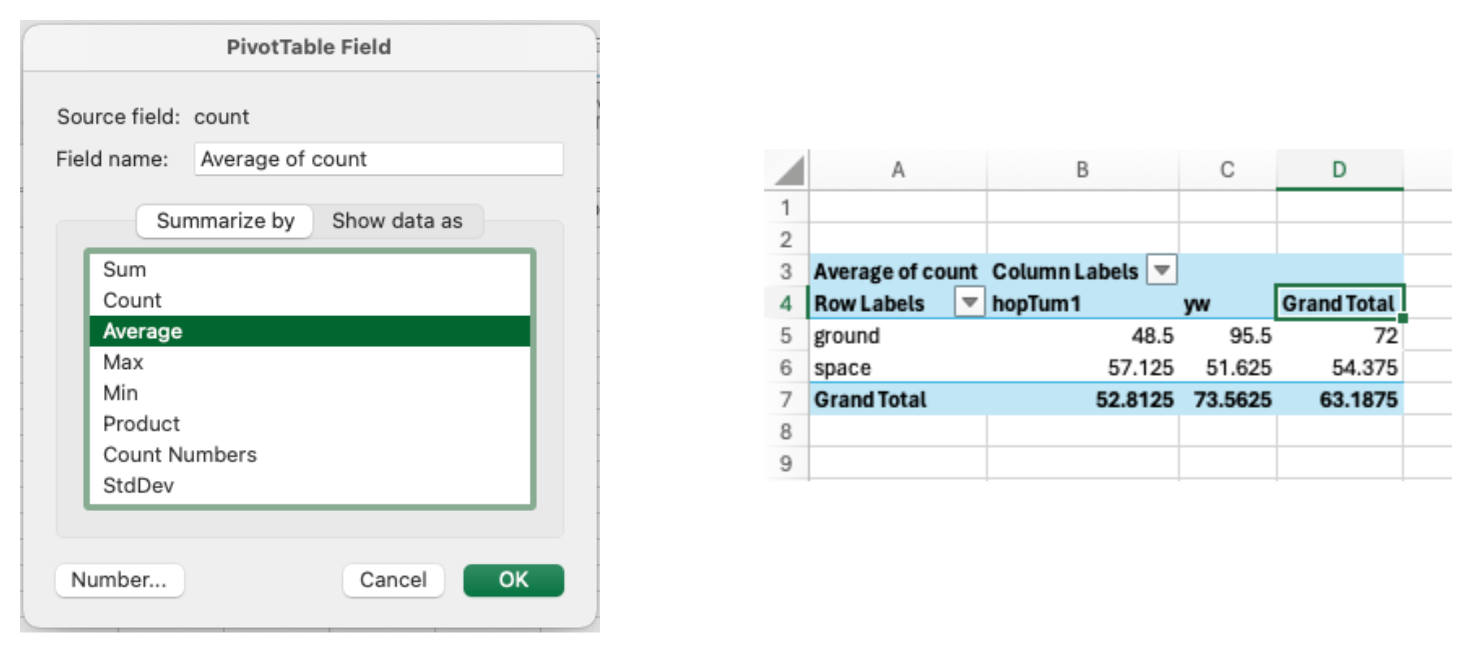
- Format numbers by right-clicking on the values and selecting “Value Field Settings.”
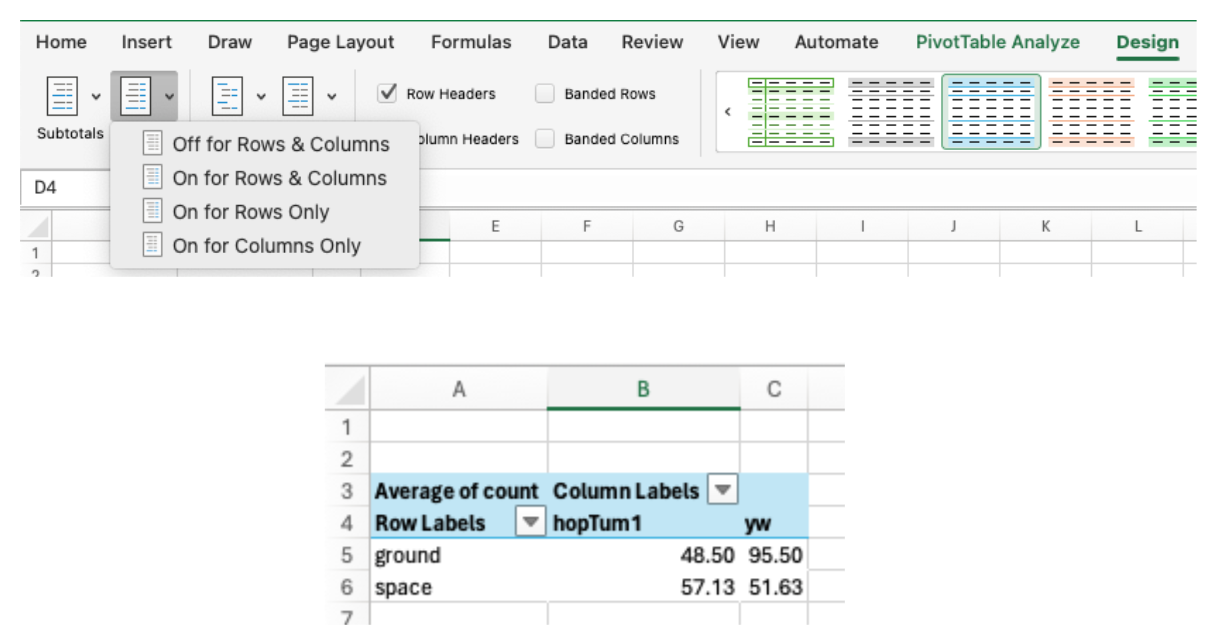
- Enhance Your PivotTable:
- Group dates or other data if needed for better organization.
- Use the “Design” tab to change the layout and style of your PivotTable.
- For instance, remove the “Grand Totals” column and row for your table:
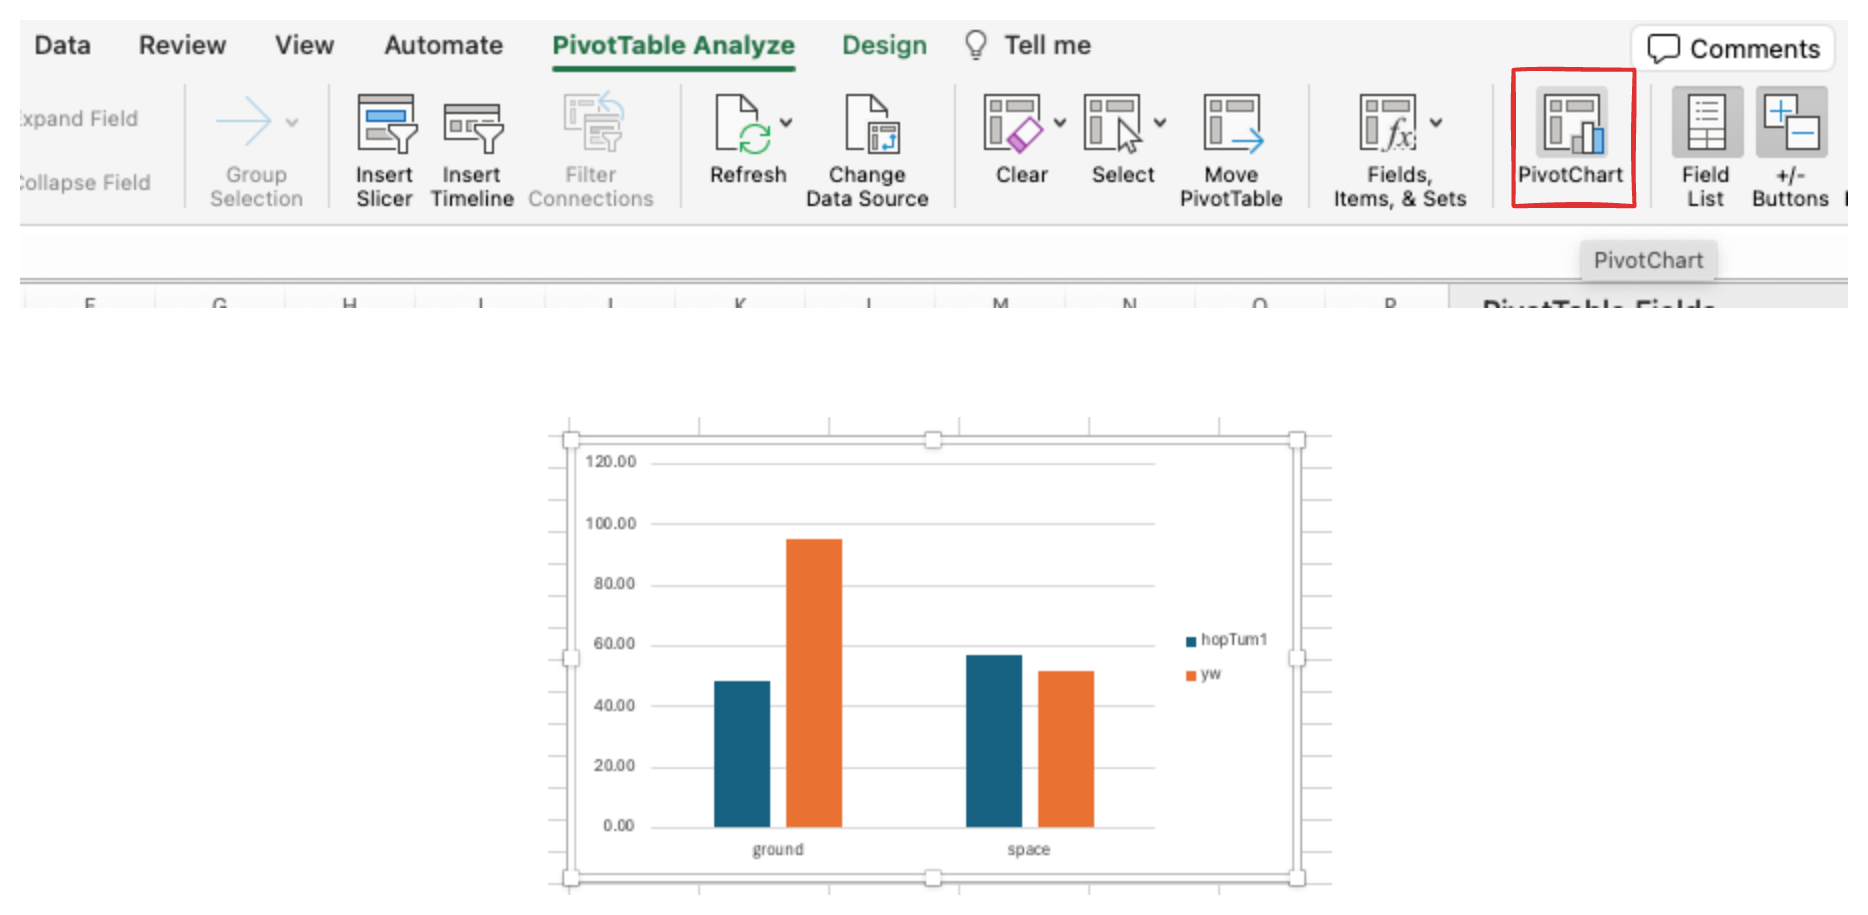
- Add a chart
-
Visualize your table as a chart
-
Go to the “PivotTable Analyze” tab and click on “PivotChart”
Pivot tables are very powerful for understanding your data! To dive deeper, I highly recommend starting with this video tutorial by Kevin Stratvert.
Excel exercise
This week, you will create a Pivot Table and data visualization for Dr. Jeruzalmi’s data in Excel. You need to complete two tasks:
-
You want to summarize your data to see if the average mass-to-charge ratio of the RctB protein domains is similar or differ between mutants and wild types. Create a Pivot Table that returns the averages of the “mz” column for each “rctb_ID” and “variant_class”, where the rows are RctB IDs and columns are variant classes.
It should look something like this: (it will look slightly different with different values)
-
From this Pivot Table, create a bar plot of the average mass-to-charge ratio across RctB IDs and variant classes.
It should look something like this:
Answer the following question about the data:
- Based on the Pivot Table and bar plot, which hypothesis does the data support?
After you’re finished, upload the workbook and the lab worksheet to Blackboard.
References
Before you leave
Fill out the Weekly Feedback Form.
Lab materials inspired by Data Nuggets.
Excel background sources:
[1] https://support.microsoft.com/en-us/office/video-create-a-pivottable-manually-9b49f876-8abb-4e9a-bb2e-ac4e781df657 [2] https://www.youtube.com/watch?v=9NUjHBNWe9M [3] https://www.journalofaccountancy.com/newsletters/extra-credit/use-excel-pivottables-to-analyze-grades.html [4] https://careerfoundry.com/en/blog/data-analytics/how-to-create-a-pivot-table/ [5] https://www.youtube.com/watch?v=aQbiA_l1MoM