Week 7: Regulation of cone photoreceptor development
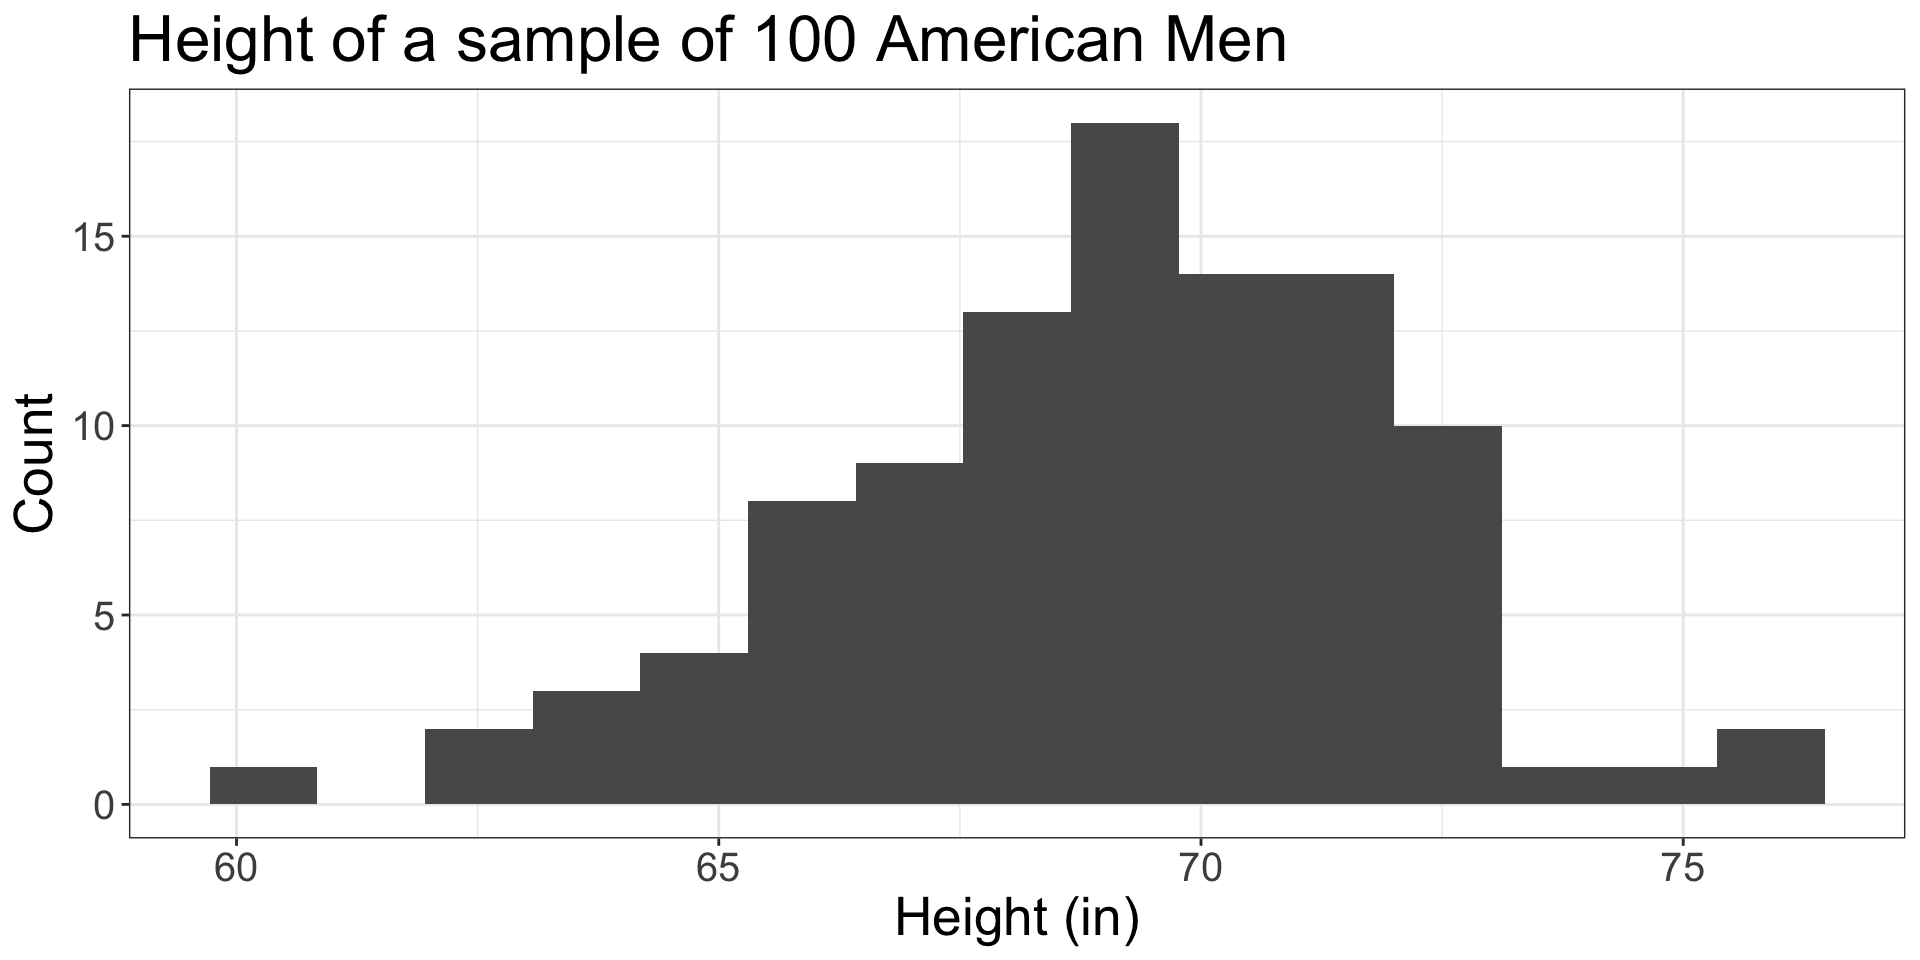
Histogram
Single, continuous variable
Measurements like height, weight, temperature, etc.
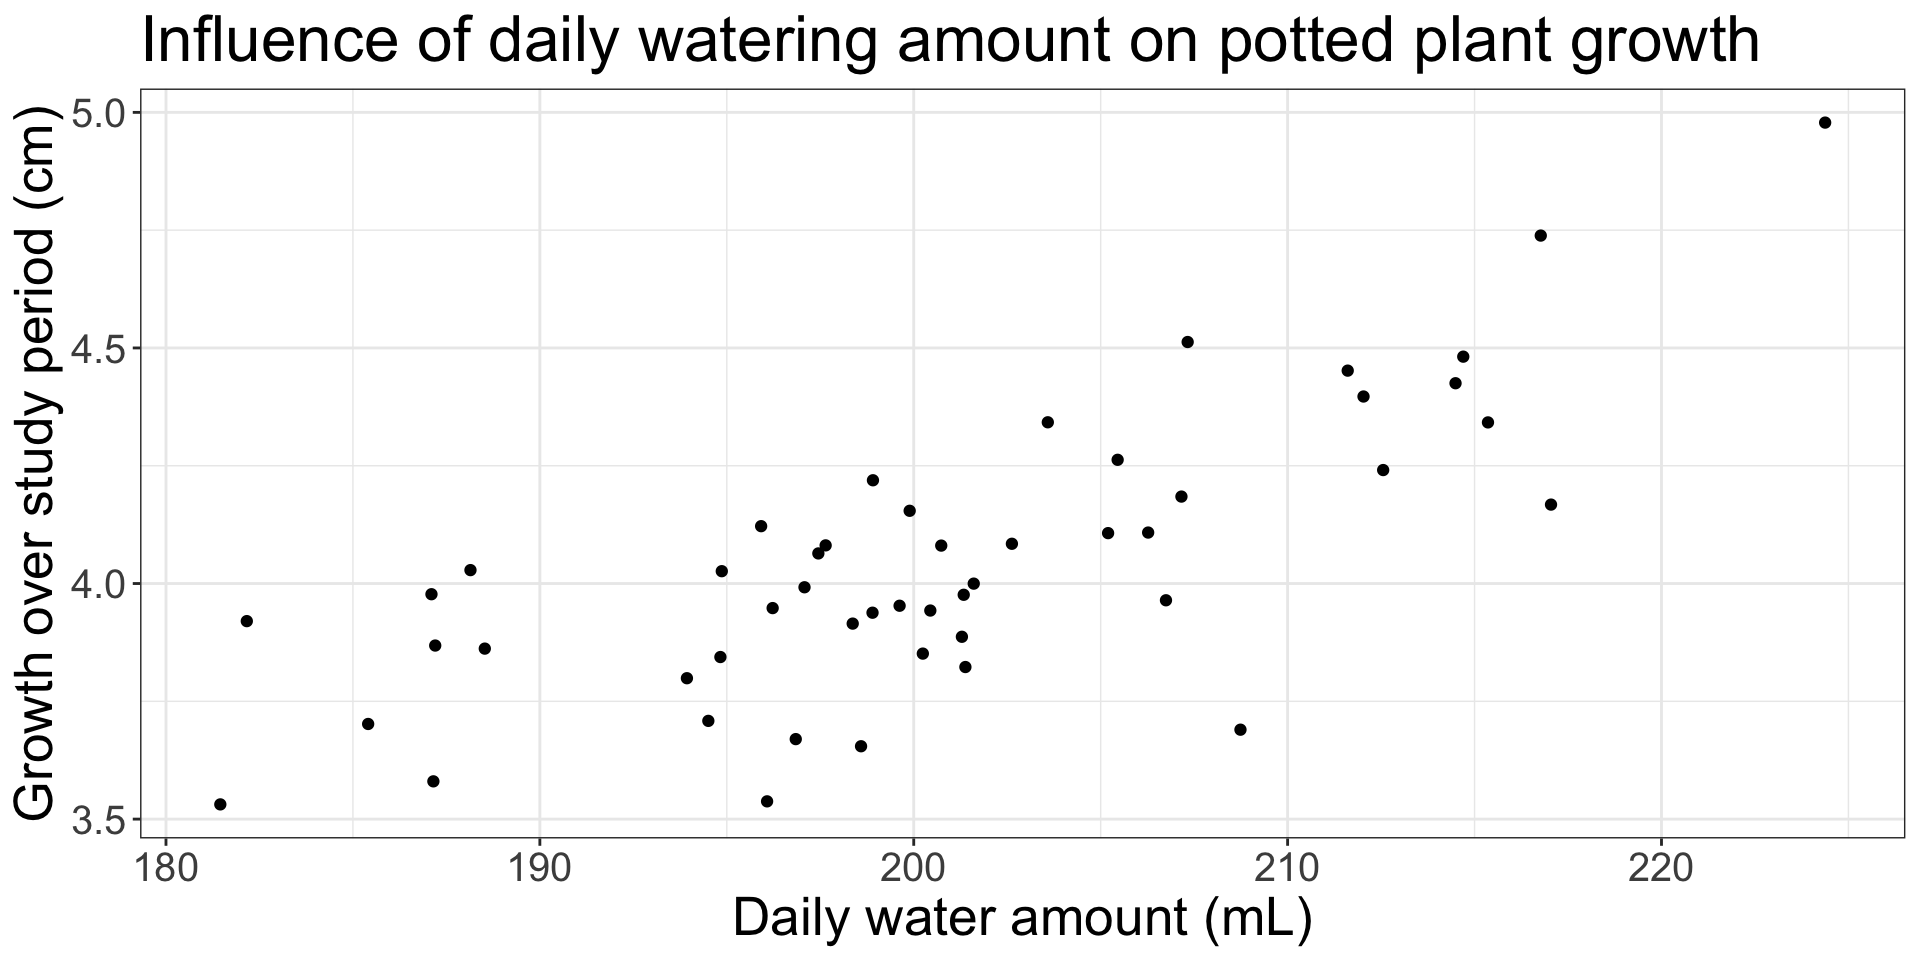
Scatterplot
Two continuous variables
x-axis (horizontal) is a dependent variable
y-axis (vertical) is an independent variable
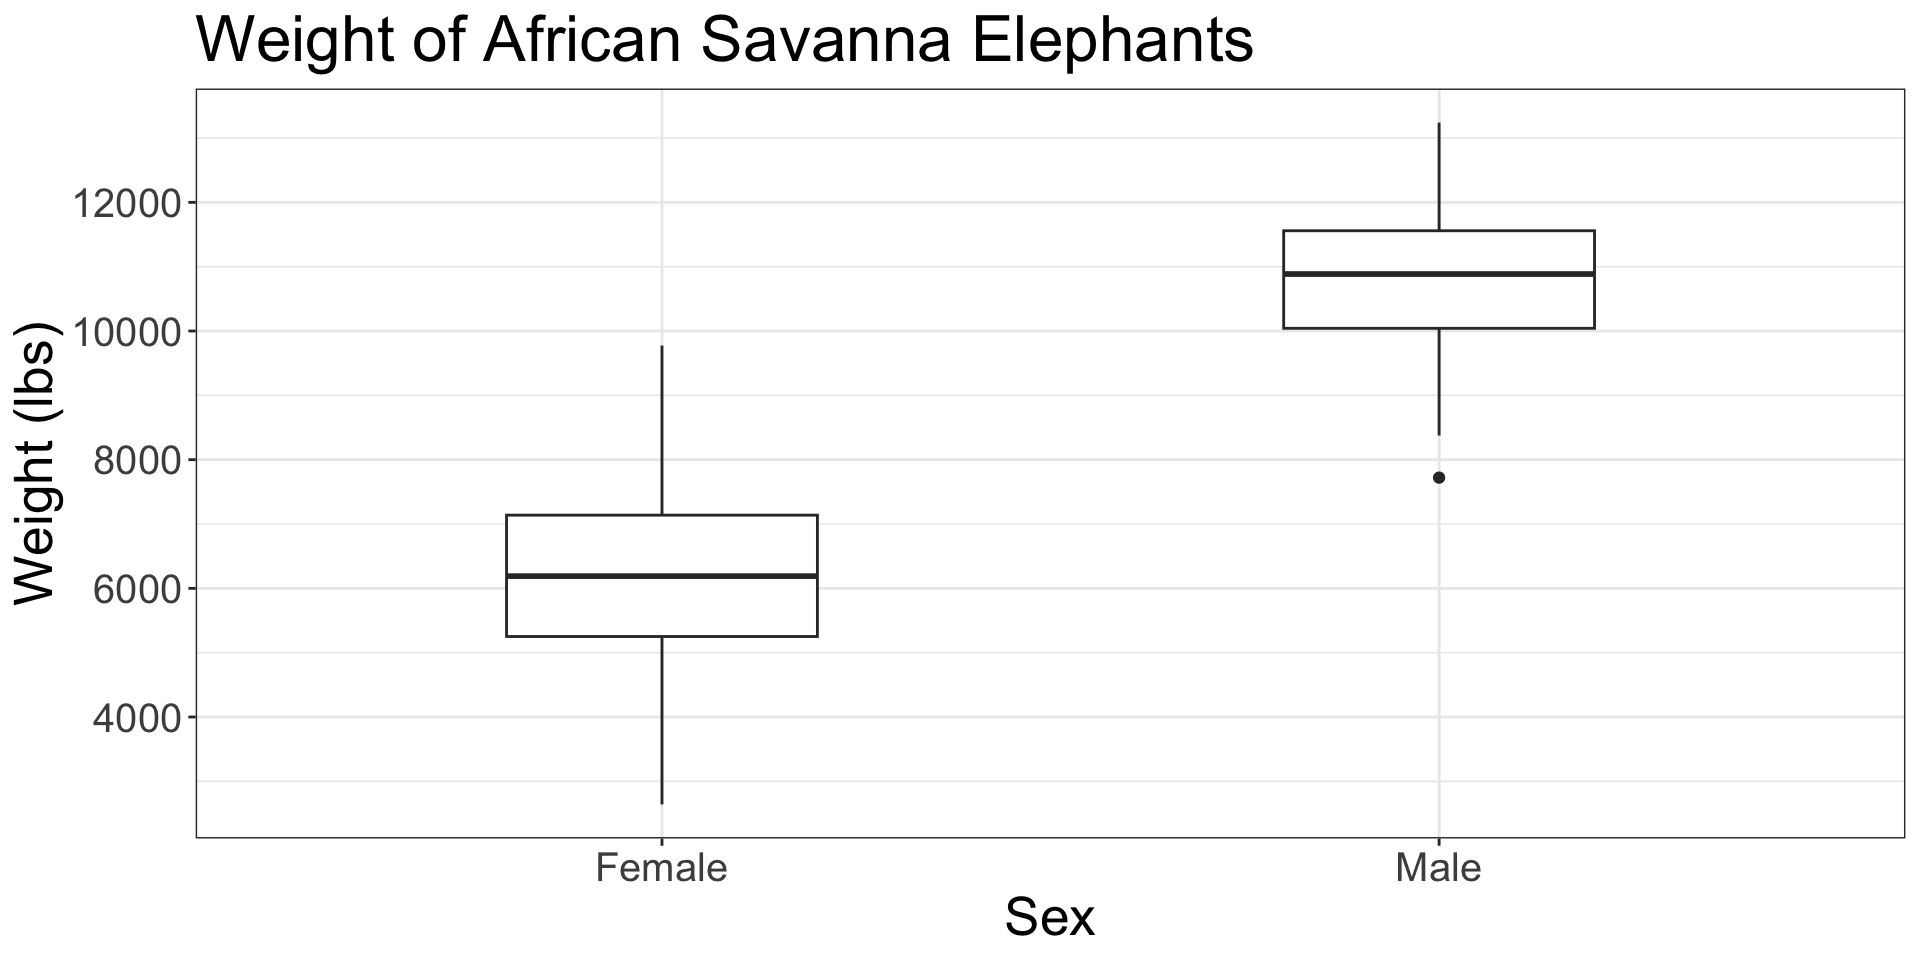
Box and whisker plot
Grouped continuous variable
Groups are usually treatments you want to compare
Can have groups on x-axis and continuous variable on y-axis, or the other way around
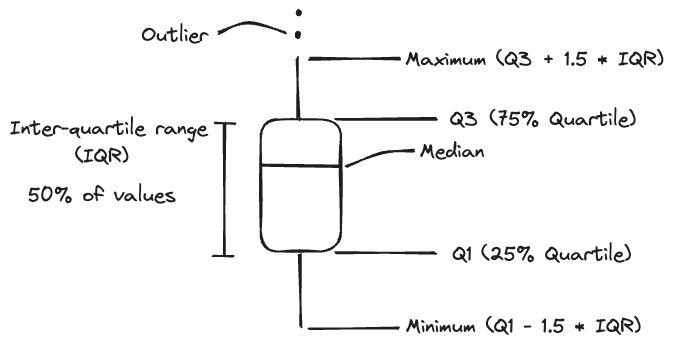
Box and whisker plot
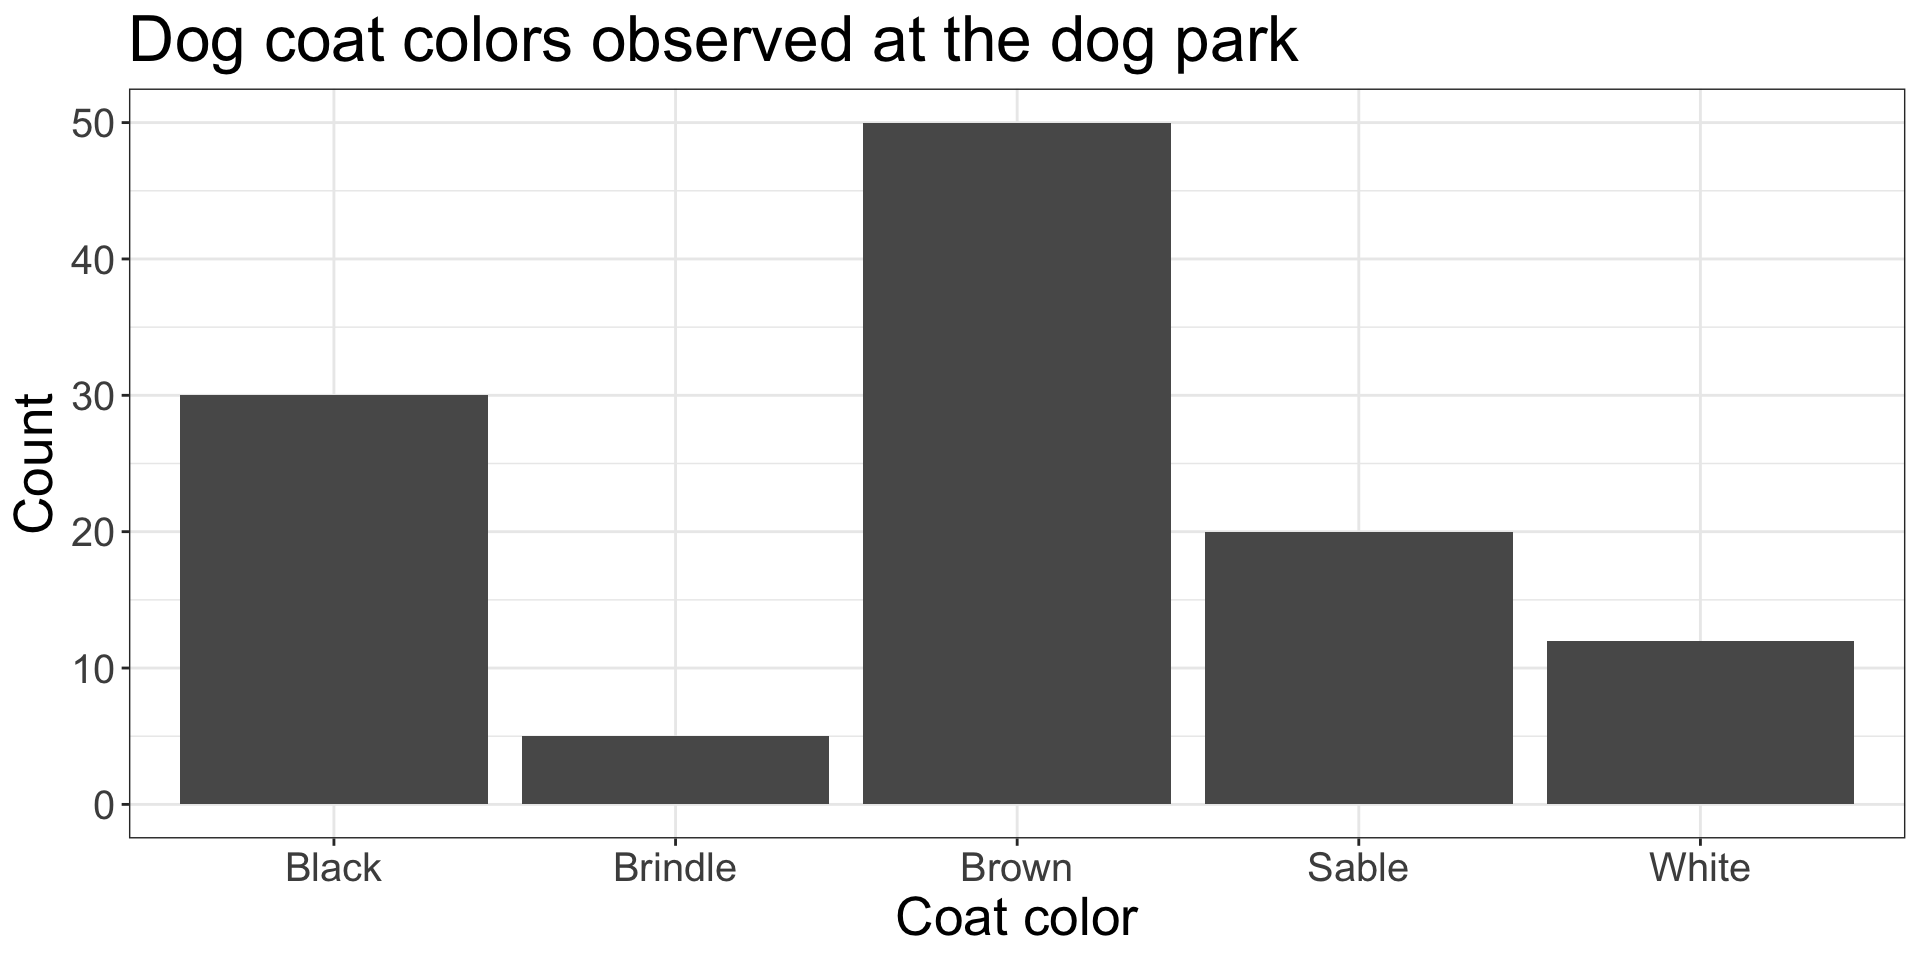
Bar plot
Discrete numerical or categorical variable
x-axis is discrete/categorical variable, y-axis is counts