dss_2024
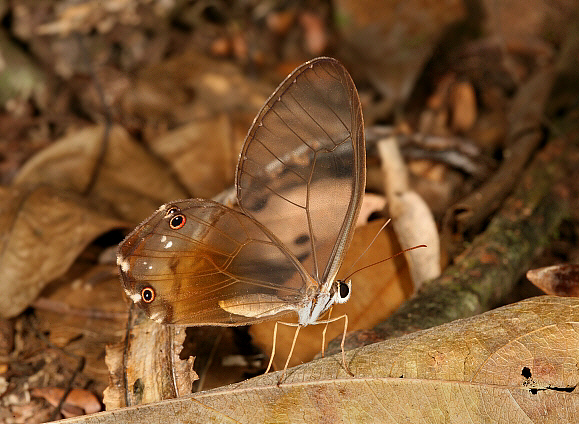
Butterflies in the rainforest
Featured scientists
Research Background
Rainforests are complex ecosystems that support an incredible diversity of life. This diversity is evident not only as you walk through the forest, but as you climb. The forest is stratified, meaning that the organisms you see change as you climb up and down the forest ecosystem. The four strata in a rainforest are the emergent layer, the canopy, the understory, and the forest floor.
The emergent layer is composed of the tallest trees that tower above the rest of the forest. They stick out, vulnerable to the often violent weather. Plants and animals adapted to this strata must be able to withstand intense light, shifts from rain storms to dryness, and blustering wind. Due to this harsh environment, diversity is lower than the other strata, although the organisms’ adaptations can be marvelous.

The canopy is the thick layer of greenery below the emergent layer. On average about 20 feet thick, it shields its inhabitants from the intense weather fluctuations that batter the emergent layer. Sunlight enters through tiny openings, scattering across the lower strata, resulting in dim, rather than brilliant light. Rain is reduced to fine droplets and sheets pouring down tree trunks and wind is almost non-existent except for forest openings. The canopy contains the most species of the four strata, where plants, animals, and fungi form intricate relationships with each other. Trees and flowering plants require animals for dispersal rather than wind, resulting in at least some species flowering at any point of the year. While many charismatic vertebrates inhabit the canopy, like toucans and howler monkeys, the vast majority of animal species in the canopy are insects. Hundreds of species of beetles can be found on a single tree!

The understory is made up of young and short trees, shrubs, and plants without woody stems. It is even more dim than the canopy, forcing flowering plants to use more extreme methods to attract pollinators- larger, paler flowers and intense fragrances from sweet to smelly. Less dense vegetation allows for flying animals to move more freely. This also attracts their predators, which include tree frogs hunting flies and spiders catching birds! Frogs enjoy the higher humidity, which provides a suitable environment for their gelatinous eggs to develop.

The forest floor is very dark- a tiny fraction of light from the emergent layer makes it all the way down. Organisms adapted to obtaining their nutrition from decaying matter thrive here- fungi, plants, and an abundance of leaf-litter insects. Foraging animals like peccaries and armadillos root through the detritus, eating plant tubers and insects. Their predators lurk in the shadows- jaguars and cayman stalk their unsuspecting prey until the right moment.
Butterflies occupy all four strata, with brilliant blue morphos fluttering above the emergent layer, fruit-feeding nymphalids traversing the canopy and understory, and low-flying Haertini cruising above the forest floor.

The outstanding diversity of butterflies (over 18,700 species worldwide!) is evident at all rainforest strata, although their diversity is most pronounced in the canopy and the understory. While the canopy and understory are close together, many species are restricted to one stratum or the other. Butterflies are adapted to the unique ecological characteristics of the strata. For instance, an abundance of nectar-rich flowers in the canopy will attract certain butterflies, while an abundance of shelter and prey in the understory may attract others.
Dr. David Lohman and his colleagues are interested in understanding the evolutionary relationships of butterflies and the evolution of their ecological traits. The stark differences in the number of species and their abundance across rainforest strata provide the opportunity to understand why these differences occur. Over the course of three years of field work in Thailand rainforests, Dr. Lohman and colleagues trapped butterflies in the canopy and understory. In addition to counting and classifying the butterflies they trapped, they collected weather data for each trap, noting aspects of the temperature, humidity, rainfall, and more about each trap and when it was sampled. A portion of these data are summarized in the section Scientific Data below.
Scientific Questions
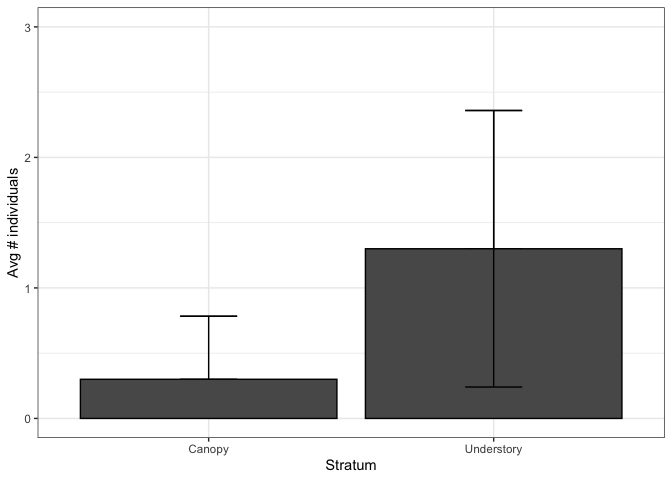
Q1: Are butterflies more abundant in the canopy or the understory?
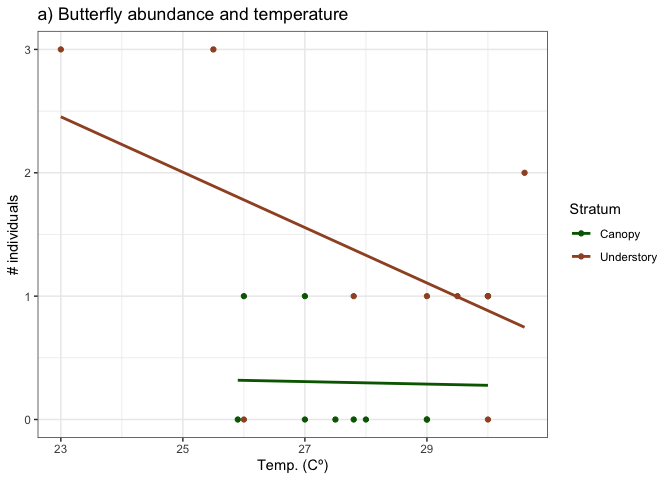
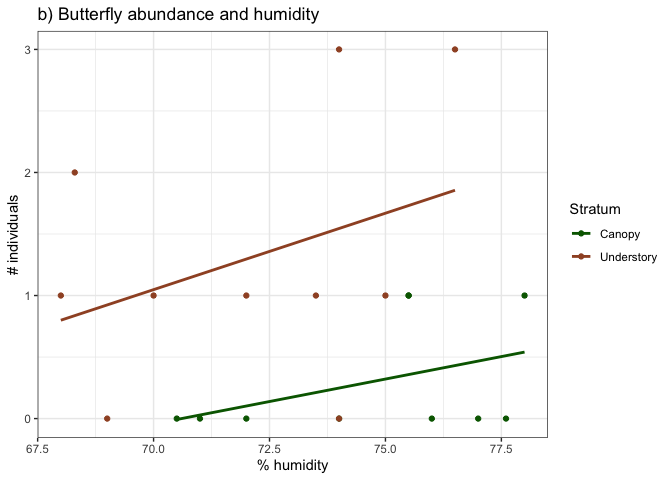
Q2: What aspects of the environment influence butterfly abundance?
Scientific Data
| Stratum | Temp. (Cº) | % humidity | # individuals |
|---|---|---|---|
| Canopy | 27.0 | 75.5 | 1 |
| Canopy | 27.8 | 76.0 | 0 |
| Canopy | 27.0 | 70.5 | 0 |
| Canopy | 26.0 | 78.0 | 1 |
| Canopy | 28.0 | 77.0 | 0 |
| Canopy | 25.9 | 77.6 | 0 |
| Canopy | 27.5 | 72.0 | 0 |
| Canopy | 29.0 | 71.0 | 0 |
| Canopy | 30.0 | 75.5 | 1 |
| Canopy | 29.0 | 74.0 | 0 |
| Understory | 30.0 | 68.0 | 1 |
| Understory | 30.6 | 68.3 | 2 |
| Understory | 25.5 | 76.5 | 3 |
| Understory | 27.8 | 73.5 | 1 |
| Understory | 30.0 | 69.0 | 0 |
| Understory | 29.0 | 70.0 | 1 |
| Understory | 30.0 | 72.0 | 1 |
| Understory | 26.0 | 74.0 | 0 |
| Understory | 29.5 | 75.0 | 1 |
| Understory | 23.0 | 74.0 | 3 |
- Which data will you need to answer Q1?
Dependent variable:
Independent variable(s):
Here is a relevant graph to answer Q1:
- Which data will you need to answer Q2?
Dependent variable:
Independent variable(s):
Here are a couple graphs relevant to Q2:
-
What are the treatment groups for both questions the authors are trying to answer?
-
***Do the authors have a control group? If so, what is it?
-
Is the study design Dr. Lohman and colleagues used an observational study or an experiment? Why?
Interpret the data
- Based on the above plots, what can the authors say about Q1? What about Q2?
Excel exercise
Today you’re going to learn two more data manipulation strategies that help you organize and understand your data.
Sorting
The first is sorting your data. Often your data has an order to it,
whether it is alphabetical, date-time, or numerical. You may want to
know the minimum or maximum values in your data set, or know how other
variables are structured according to your ordered variable- for
instance, you can get a quick look to see if the weather has gotten
warmer over time by taking a data set with dates and temperature and
ordering it according to the date! Although the best way to get these
kinds of insights is through data visualization, which we will explore
next week, ordering your data is a great first pass. To get you up to
speed, I will guide you through the basics. If you would like to get
some more practice, you can follow the examples in this W3Schools
exercise. To follow
along with their examples, open a blank spreadsheet and copy-paste the
values they use in the example (the Copy Values button) into the
spreadsheet.
Concatenating
The second is concatenating cells and columns. This is the opposite of
what you learned last week- Text to Column. Concatenating involves
taking two cells or columns and joining them in a new column using the
CONCAT() function in Excel. This is often useful when you want to
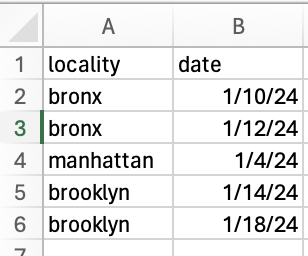
create unique IDs for your observations. For instance, say you have a
column with the locality name and a column with the date you visited the
locality:
You can use the CONCAT() function to combine the two columns into a
unique identifier for that locality and date:
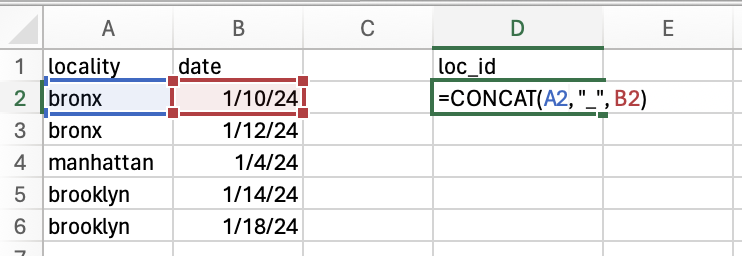
Where the “_” in the middle is called a delimiter. It splits the output like so:
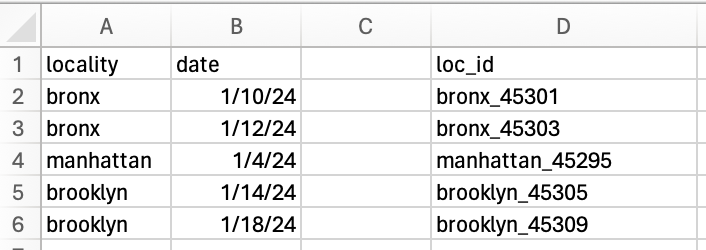
You may notice that the numbers at the end of the ID don’t look like the dates you entered- that is because Excel likes to do funny things with dates under the hood and is okay, as long as each value is unique! I’ll show you more examples in class, but see this W3Schools tutorial for more practice.
Exercise
Download this spreadsheet of the raw butterfly abundance
data
from Blackboard. Sort the data by the temp_c from smallest to largest
and answer the following question:
- What is percent humidity and number of specimens associated with the lowest temperature in the data set?
After answering the question (and all questions before), make sure to upload your Excel spreadsheet and the worksheet to Blackboard!
Excel materials inspired or sourced from W3Schools. Lab materials inspired by Data Nuggets.