dss_2024
Fruit flies in space
Featured scientist
Research Background
As space exploration has grown, space’s impact on health is increasingly relevant. Microgravity- the reduced impact of gravity on the body when in space- reduces bone density in astronauts, requiring them to maintain a strict workout regimen and diet. Additionally, stronger radiation in space has a multitude of potential effects, including the disruption of immune function and potentially higher rates of cancer. As a more diverse population of humans make the trek to space for longer periods of time, the impact of space travel on those with pre-existing conditions or a genetic predisposition to compromised immune function and disease is more relevant.
While it is difficult to send a diverse cohort of humans to space to better understand the impact of space on disease, so-called model organisms can go in their place. Model organisms allow scientists to study specific questions, like disease, in an organismal system that is at one end easier to study and at the other end less ethically ambiguous. Fruit flies (genus Drosophila) are an ideal study system for disease genetics because of their simple, small genomes, ease of care, and rapid generation times.
They are also ideal candidates for studying animals in space- they were in fact the first living and sentient organisms to go to space (in 1946)! Because of these qualities, Dr. Shubha Govind and colleagues chose to use fruit flies to study the impact of space on survival and immune gene expression Chou et al. (2024).
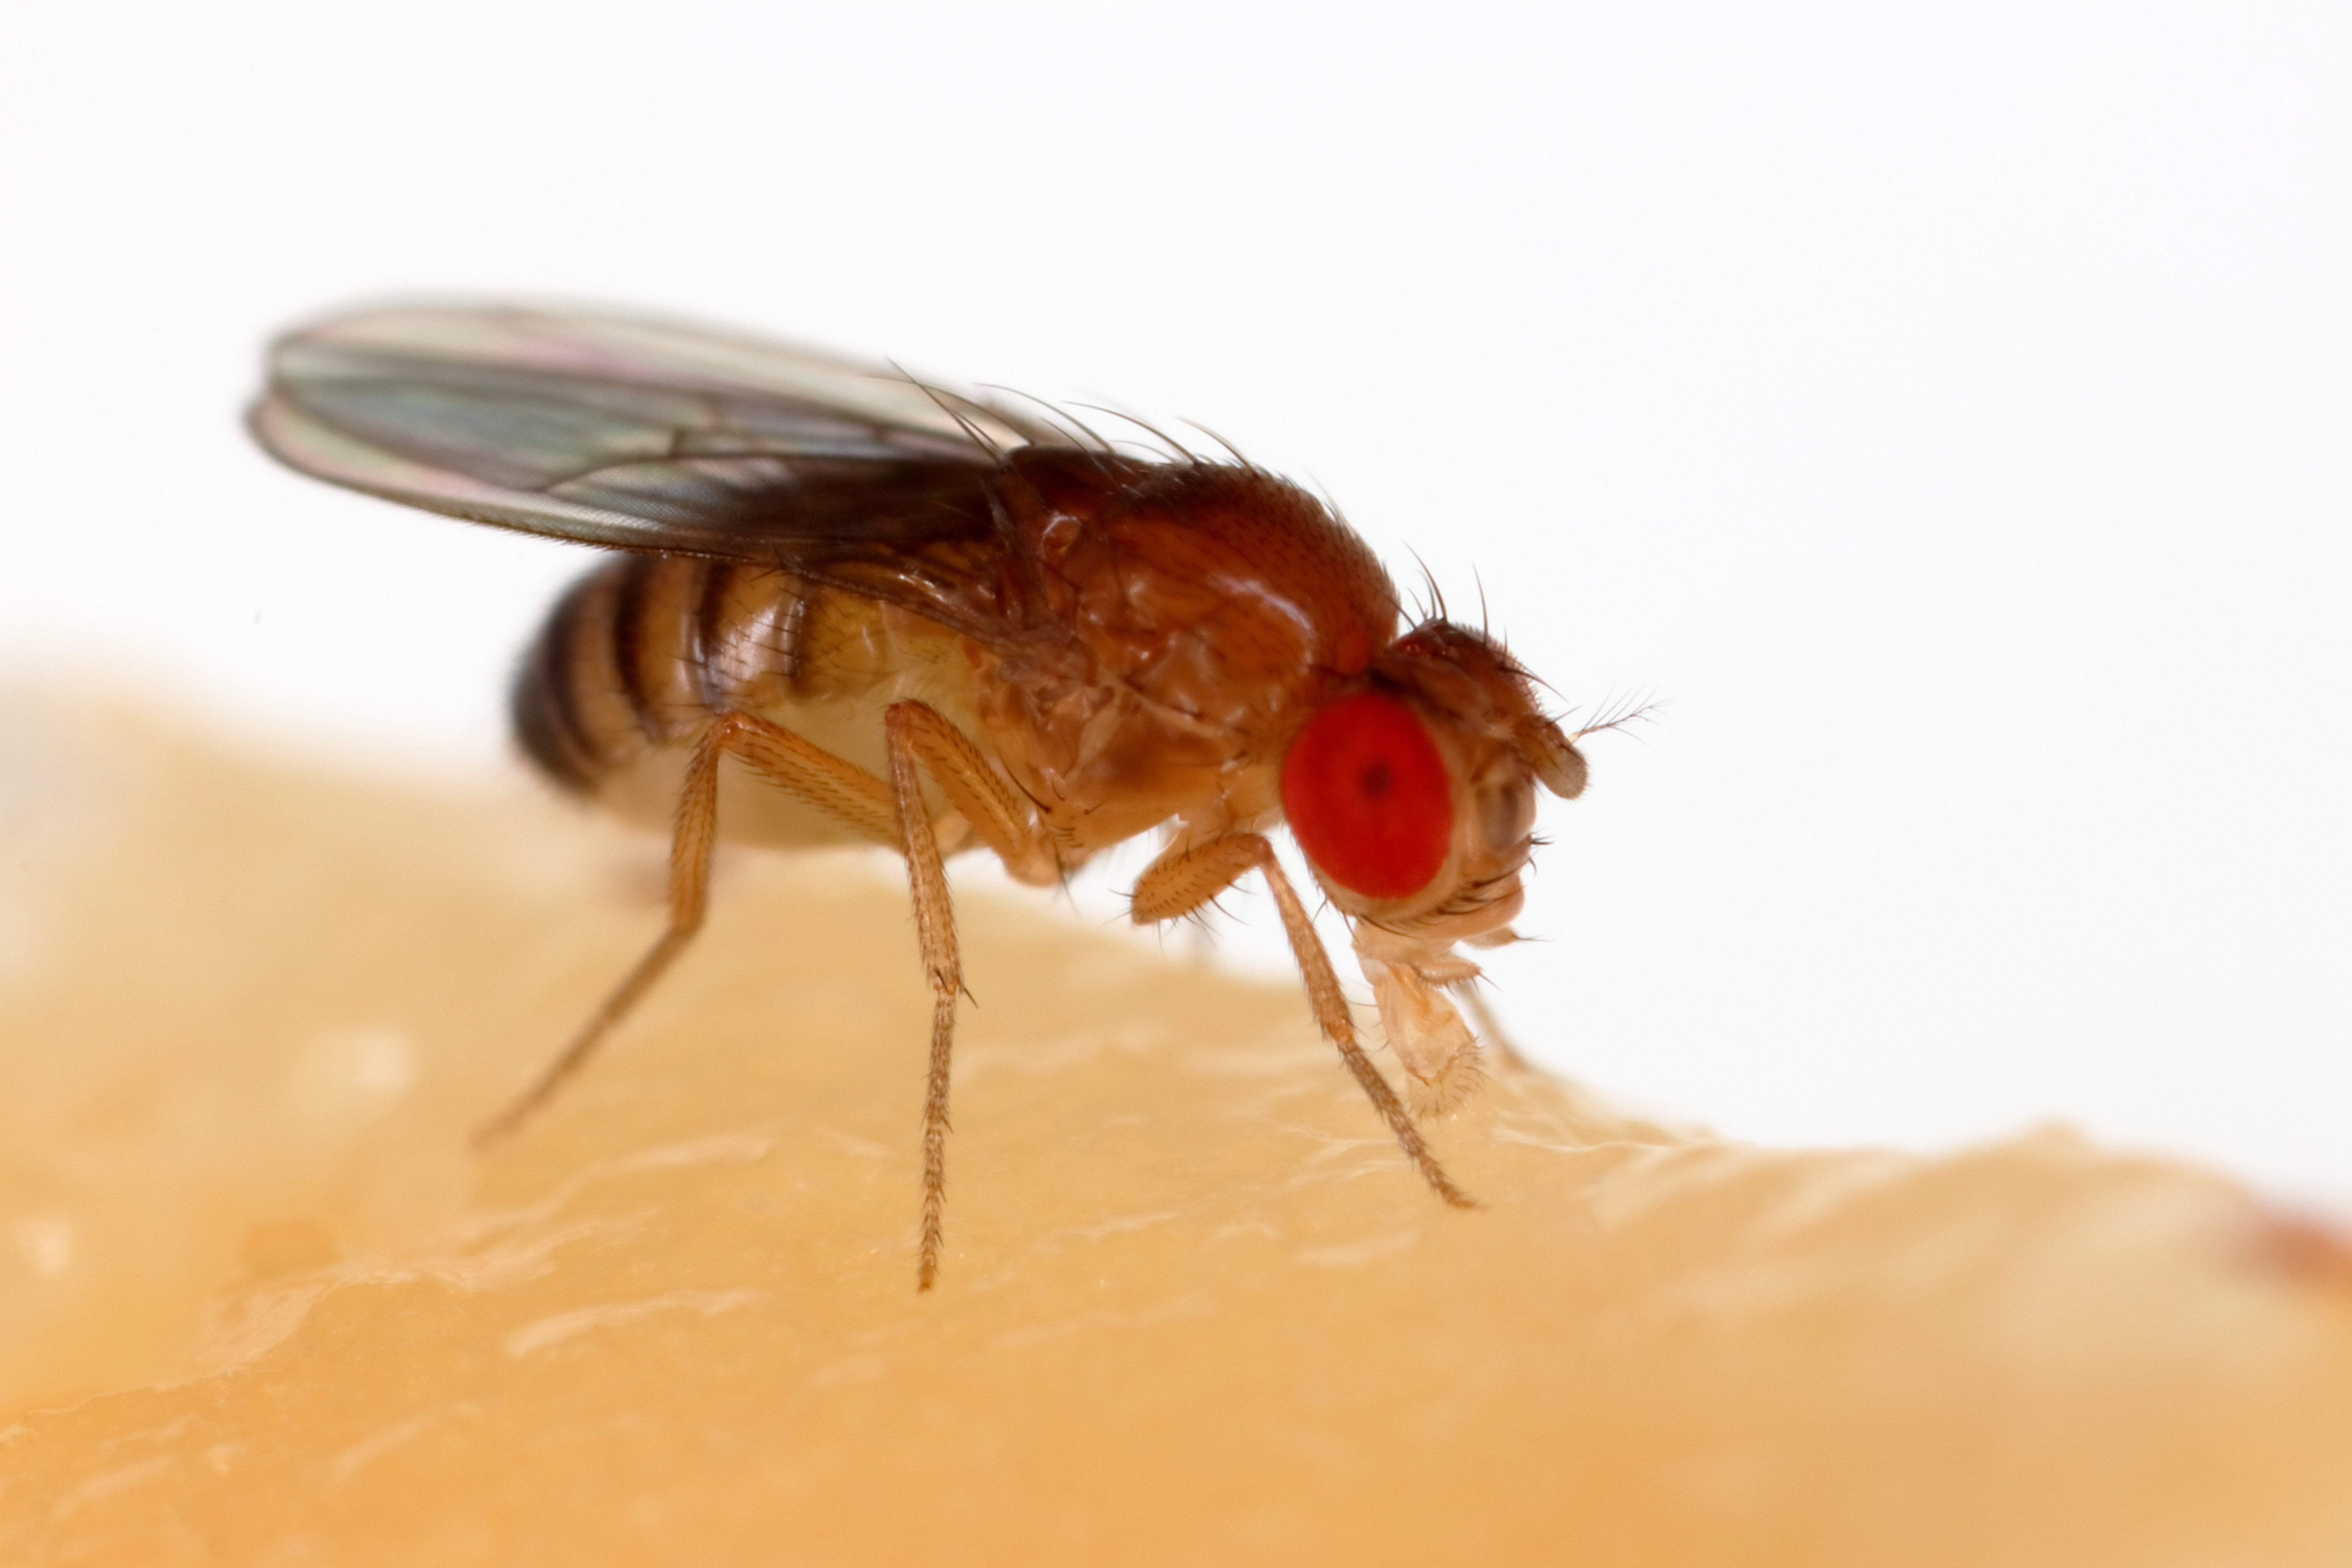
They used two strains of fruit flies- a control strain and an immunocompromised strain. The control strain has the yw genetic background, which means that they have the gene for white eyes:
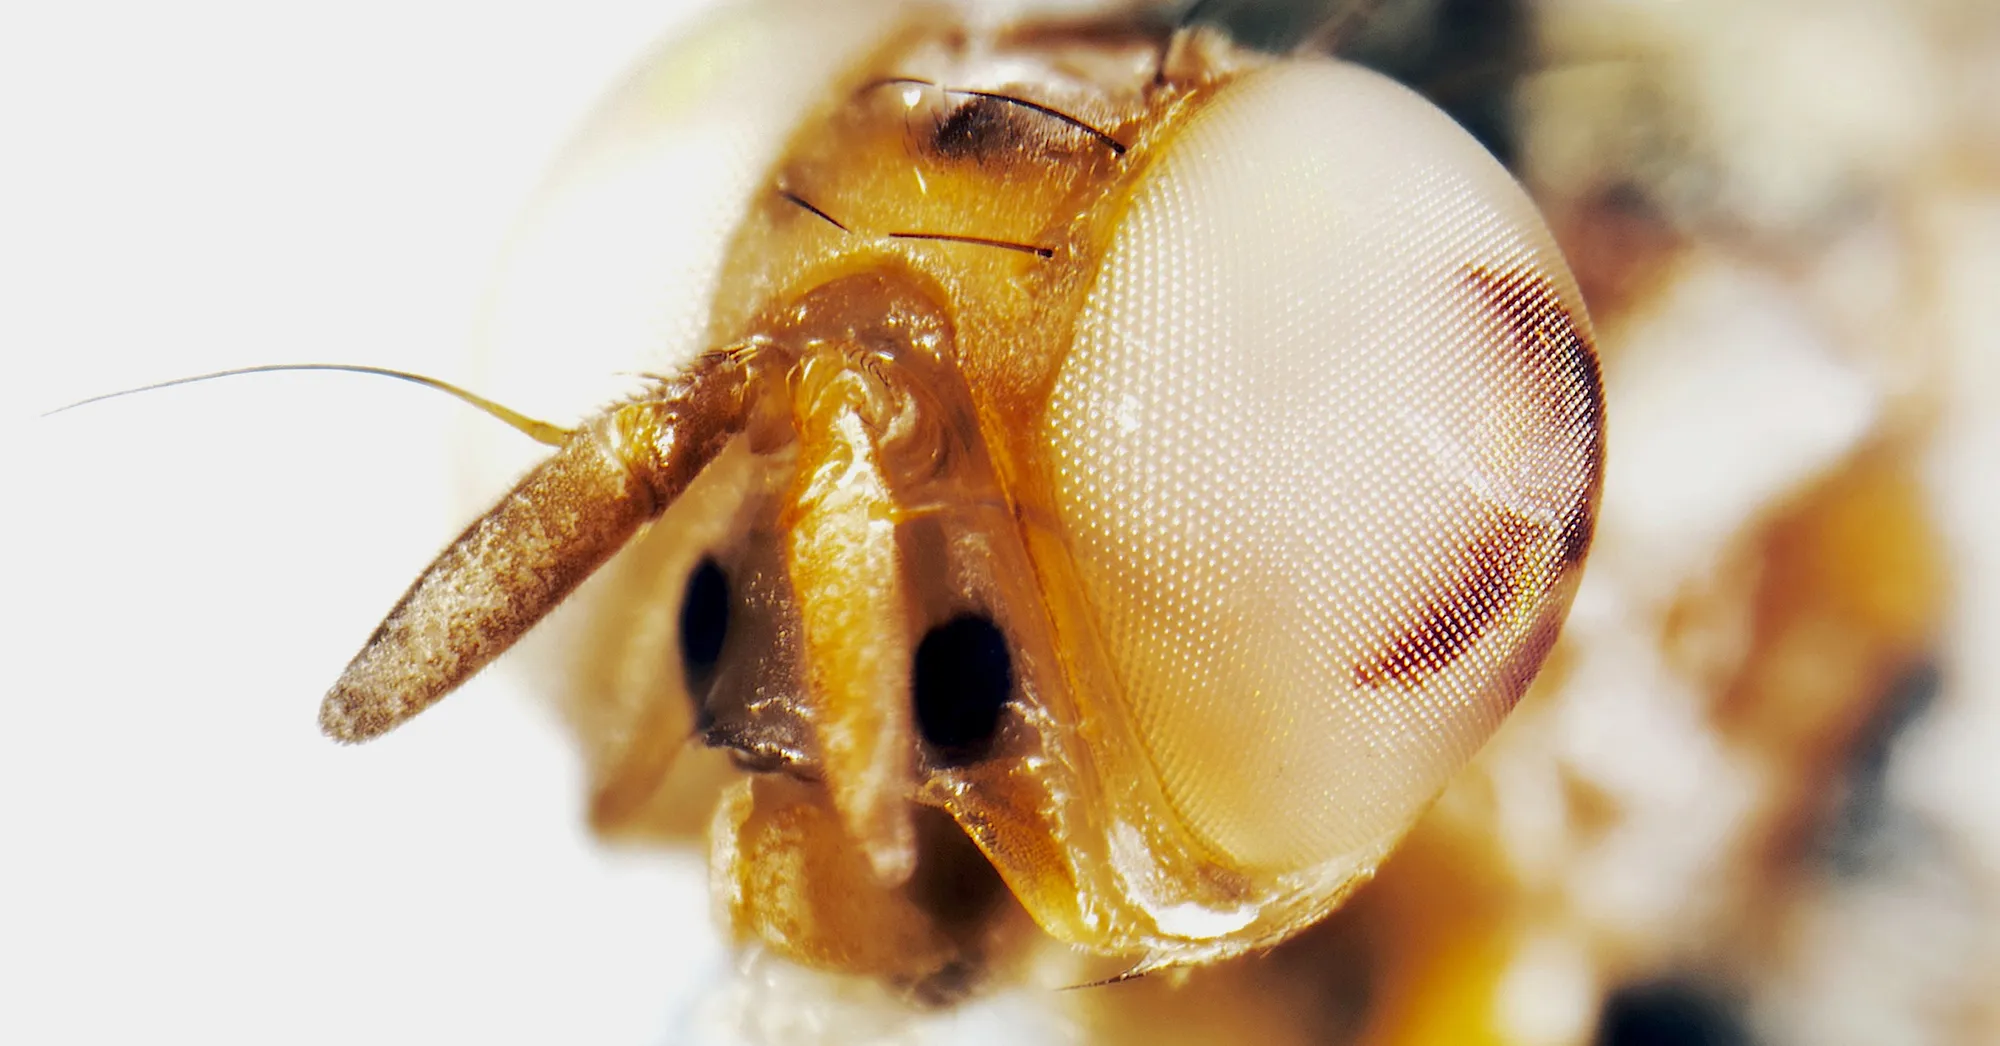
In the context of the study, this strain has a natural, non-mutated (aka “wild type”) genetic background for all of the genes of interest. The immunocompromised strain has the hopTum-I genetic background. This gene triggers chronic inflammation and tumor growth, and is expected to negatively impact survival and immune function in flies that carry it.
Dr. Govind and colleagues sent one group of flies to space and kept another group on earth to compare their survival and immune function. For each group, they added an equal proportion of males and females to vials that contained the necessary nutrients for survival. They expected the yw flies to have higher survival rates in space and on earth compared to the hopTum-I flies. They also expected both groups to have higher survival on earth compared to space. However, they expected space to have less of an effect on yw flies compared to hopTum-I flies, since yw flies are not predisposed to chronic inflammation and tumor growth. For this worksheet, we will ignore their predictions and data for immune function.
Scientific Question
1. Based on the background information provided, what is the question Dr. Govind et al. are asking in their study?
Next, let’s glance at the data they collected to better understand the hypothesis they wanted to test.
Scientific Data
| vial_id | location | sex | gene | count |
|---|---|---|---|---|
| vyw1 | ground | male | yw | 89 |
| vyw1 | ground | female | yw | 117 |
| vyw1 | space | male | yw | 37 |
| vyw1 | space | female | yw | 60 |
| vht1 | ground | male | hopTum1 | 8 |
| vht1 | ground | female | hopTum1 | 36 |
| vht1 | space | male | hopTum1 | 58 |
| vht1 | space | female | hopTum1 | 65 |
Table 1. An example of the data used in Chou et al. 2024. An additional subset of the data set is available in an Excel spreadsheet linked further down in the worksheet.
| vial_id | gene |
|---|---|
| vyw1 | yw |
| vyw2 | hopTum1 |
| vyw3 | |
| vyw4 | |
| vht1 | |
| vht2 | |
| vht3 | |
| vht4 |
: Table 2. A dictionary of codes and correct spellings for the data table.
Hypothesis
2. From the background information, data table, and figure, what hypothesis are they testing?
3. Based on this hypothesis and the data table, what are the dependent and independent variables being used to answer this hypothesis? Note- there is only one dependent variable, but there can be one or more independent variables.
Dependent variable:
Independent variable(s):
Excel exercise
Today you are going to learn two data cleaning skills in Excel:
- how to use spell check dictionaries to assist with data cleaning in Excel
- splitting text into multiple columns
Custom dictionaries
Data dictionaries are a necessary component of data collection. They contain a guide to the codes, words, and abbreviations used during data collection. They are important to make sure that anyone viewing the data understands what it represents- and by anyone, that includes future you too! Usually the dictionary is entered as an additional sheet in an Excel workbook or as a plain text file.
Besides making sure the data are understood, data dictionaries help when it comes time for data analysis. Human error always occurs when entering data, so even if the person entering data knows a code or abbreviation, they may enter it in wrong. If you have your data dictionary available, you can use it to check your data before beginning your analysis.
A way to do this in Excel is through the use of a custom spell check dictionary. The codes and names used in research are usually not present in a typical spell check dictionary. Microsoft allows you to add a custom dictionary that you can apply to the suite of Microsoft apps for any of your projects. After you create the custom dictionary, you can perform a spell check in Excel to catch anything that may have been entered incorrectly. This can save you massive amounts of time and mistakes!
Each operating system (i.e. Windows, Mac, or online) uses spell check dictionaries a little differently. I will demonstrate how to create a custom dictionary on a Mac, but follow this link for creating a custom dictionary on the three different operating systems. Unfortunately, the method for adding words to a custom dictionary in the online version of Microsoft 365 is tedious, so if at all possible try to use a Windows or Mac Microsoft Office installation.
After creating your custom dictionary, you can check your spelling in Excel following these instructions.
Text to columns
In the field or in the lab, data entry often has to be performed quickly. This leads to data recording methods that are designed for easy entry, rather than easy analysis. A very common way to save time during data entry is to enter multiple pieces of information in a single data cell. However, for analysis you will need to split the pieces of information into their own cells. For instance, dates are often entered into a single cell:
| Date |
|---|
| February 15 2024 |
| February 16 2024 |
| February 17 2024 |
However, for an analysis, you may be interested in splitting the Date
column into three columns- the day, month, and year- to facilitate
analyzing the data at different time scales.
| Day | Month | Day |
|---|---|---|
| 15 | February | 15 |
| 16 | February | 16 |
| 17 | February | 17 |
To split a single column into multiple columns, you can use the
Text to Columns
feature.
I will demonstrate this live and more instructions are available at
this
link.
In short, you need to:
-
navigate to the
Data > Text to Columnsmenu -
select the delimiter that will be used to split your text (this is usually a comma, space, colon, or semicolon that splits the values in a cell)
-
click on the location in your sheet where you want to put the new columns
Exercise
Download this week’s Excel spreadsheet and the data dictionary (can download from Blackboard if the link doesn’t work). The spreadsheet contains some spelling mistakes that can be fixed with the data dictionary. In addition to spelling mistakes, the column titled “location_sex” contains two pieces of information that should be split into separate columns.
- Use the
Text to Columnsfeature to split the “location_sex” column into two columns. Name them what you want, but “location” and “sex” would work! - Create a custom spelling dictionary using the provided data dictionary
- Use Excel’s spell check feature to correct data entry mistakes
4. Upload the clean Excel spreadsheet to Blackboard.
Interpret the data
5. Based on the bar plot above, what can you say about your hypothesis? Is it supported or not supported? Why?
Next steps as a scientist
Science is never finished. Every answer leads to new questions, and perhaps more importantly to remember, not every answer is the final answer. Keeping this in mind,
6. What new question do you think should be investigated and why? If the new question requires new data, what data should be collected and why?
###
Once you’re finished, upload the lab worksheet to Blackboard.
References
###
Before you leave
Fill out the Weekly Feedback Form.
Excel materials inspired or sourced from W3Schools. Lab materials inspired by Data Nuggets.