dss_2024
Referential alarm calls in yellow warblers
Featured scientist
Research Background
A variety of animals use referential communication:
signals refer to specific objects in the environment, and others receiving such signals respond accordingly, revealing that these listeners understand what is being signalled Lawson et al. (2021)
For example, a bird may warn of a specific predator like a hawk using a unique signal, and other birds of the same species respond by swarming the hawk. The bird may use a separate signal to warn of a coyote, where other nearby birds flee rather than swarm.

Some birds face a specific threat- brood parasites. Brood parasites are birds that lay their eggs in the nests of other species. When a bird encounters a brood parasite, they elicit a referential signal telling nearby birds to either swarm the parasite or protect their nests. However, these signals are typically used during the day, while brood parasites typically lay their eggs in nests at dawn, just before sunrise. For the signal to have the most impact, the birds would need to modify their future behavior, by protecting their nests overnight and into the next day. It was unknown whether referential signals actually did modify future behavior, which led Dr. Mark Hauber and colleagues to investigate the question Lawson et al. (2021).
They studied the yellow warbler (Setophaga petechia, hereafter “warblers”), which express multiple anti-predator behaviors, including referential signals. Warbler’s “seet” calls refer to a specific brood parasite- brown-headed cowbirds (Molothrus ater, hereafter “cowbirds”). In contrast, their “chip” calls warn other warblers of generic threats. Either warning may prevent a cowbird from invading the nest and removing warbler eggs during the day, but they do not necessarily prevent parasitism, since cowbirds will lay their eggs at dawn. Dr. Hauber and colleagues decided to conduct an experiment to determine if the “seet” call leads to more nest protection the morning after it is elicited.

The authors used a field amplifier to expose nesting pairs of warblers to one of three signals during a 10 minute period each day- the referential signal “seet”, the general “chip”, and silence. The following morning at dawn for 80 minutes, they observed how long female warblers spent away from the nest and how many times they left the nest. If the “seet” call influences the warbler’s nest guarding behavior in the future, Dr. Hauber and colleagues expected females to reduce their time spent away from the nest and leave the nest less frequently when exposed to the “seet” call the previous day compared to when they are expose to the “chip” call or silence.
Scientific Question
Do referential signals influence the future nest guarding behavior of yellow warblers?
Hypothesis
- State the authors’ hypothesis using the if… then… structure.
Scientific Data
| nest_id | treatment | min_off | times_off |
|---|---|---|---|
| 21SLLYEWA06 | Chip | 27 | 3 |
| 21KSYEWA07 | Chip | 21 | 4 |
| 20SLLYEWA06 | Chip | 19 | 4 |
| 20SLLYEWA09 | Seet | 6 | 2 |
| 21SLLYEWA08 | Seet | 23 | 4 |
| 21SLLYEWA03 | Seet | 15 | 8 |
| 21SLLYEWA10 | Silent | 28 | 5 |
| 21SLLYEWA11 | Silent | 67 | 3 |
| 20SLLYEWA02 | Silent | 13 | 5 |
Table 1. A subset of the data used in the study. The ‘nest_id’ column is a unique identifier for each nest that was observed in the study. The ‘treatment’ column contains the signal treatment each nest received. The ‘min_off’ column indicates the number of minutes the female warbler spent off of the nest. The ‘times_off’ column indicates the number of times the female warbler left the nest.
- What are the three treatment groups?
T-Tests in Excel
What is a t-test?
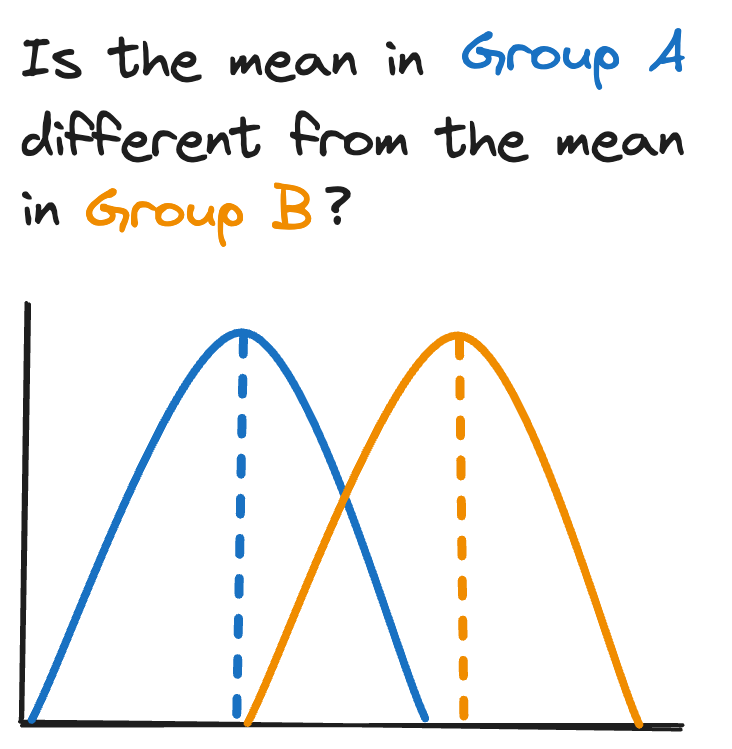
A t-test is an inferential statistics method that tests for a significant difference in means between two groups. There are a variety of t-tests that make different assumptions about the data and your analysis goals, but the core question being asked by a t-test is:
Is the mean of group A statistically significantly different from the mean of group B?
What does statistically significant mean? Assuming the data obey the assumptions of the statistical model, a statistically significant result means that the effect you observe (in this case a difference between two groups) is larger than one expected by chance. This does not mean the results are scientifically significant- that is up to you as the scientist to determine, by observing how large the effect is and whether that effect makes a biological difference in your system.
While a full introduction to the statistical foundations of t-tests is beyond the scope of this course- see Khan Academy or your favorite stats textbook- a brief overview is warranted.
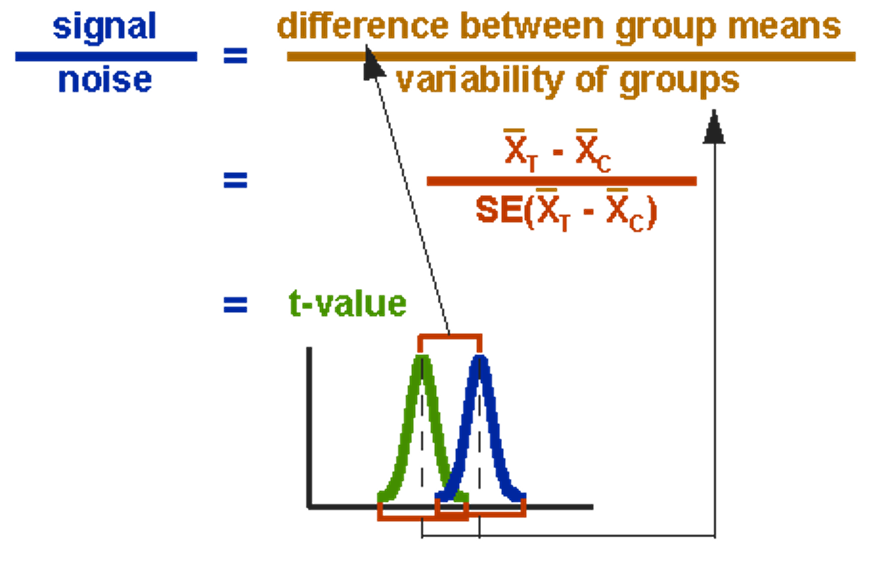
The essence of a t-test is comparing the signal (difference between group means) to the noise (variability of groups). The math in red is just a formal definition of this relationship. The t-value measures the the ratio of the signal to the noise- the higher the t-value, the more signal there is relative to noise.
A t-value close to zero indicates that there is little signal relative to noise, while a t-value farther from zero indicates more signal
The statistical test involves comparing this t-value to a critical t-value, which is the threshold of how confident you want to be that the t-value is different from zero. If the t-value is higher or lower than the critical t-value, depending on the direction of your hypothesis, the result is statistically significant. This is also represented as a p-value, where the p-value is the probability that your data are true under the null hypothesis. In the case of the t-test, it’s the probability of your data given no actual difference between the means of the two groups.
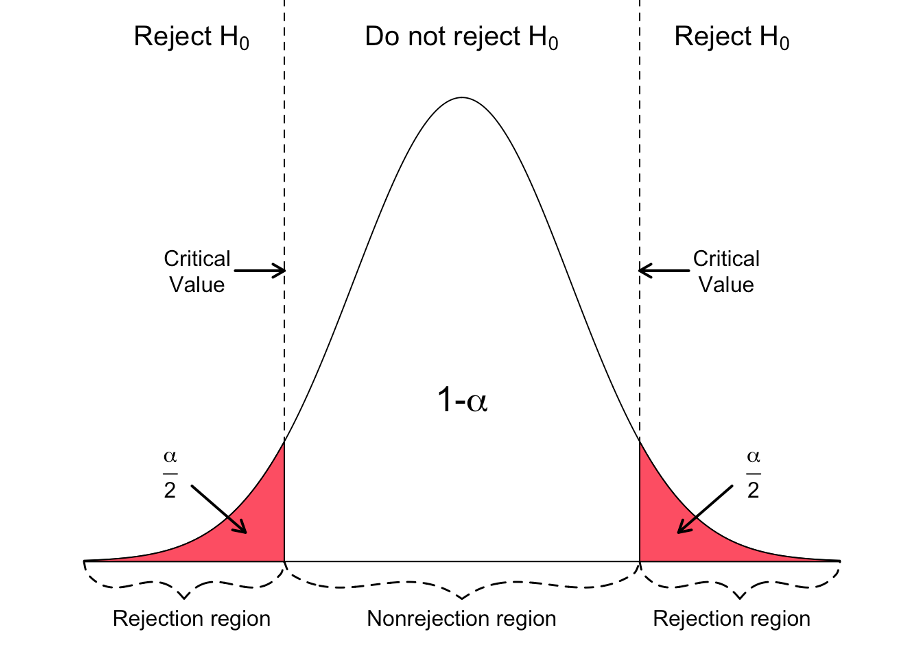
What determines the threshold at which you choose to reject or fail to reject your null hypothesis? The alpha (α) value is a scientifically agreed-upon threshold used across fields. In most scientific papers, you will see an alpha of 0.05 used (although this is argued about a bunch). If your p-value is less than 0.05, then you can reject the null hypothesis and say that the difference in means between the two groups is not due to chance. If your p-value is greater than or equal to 0.05, then you fail to reject the null hypothesis and cannot say that the difference in means between the two groups isn’t due to chance.
Implementing t-tests in Excel
If you would like to follow along, I am using the Excel workbook from Week 10.
To conduct a t-test in Excel, you need the Data Analysis ToolPak. If you don’t already have it loaded, follow these instructions to install the ToolPak.
After loading the Analysis ToolPak, you can access it under the Data tab on the right-hand side of the toolbar. The icon reads “Data Analysis”

After clicking on it, you have a variety of statistical tests to choose from. The relevant tests begin with “t-Test: Two-Sample”.
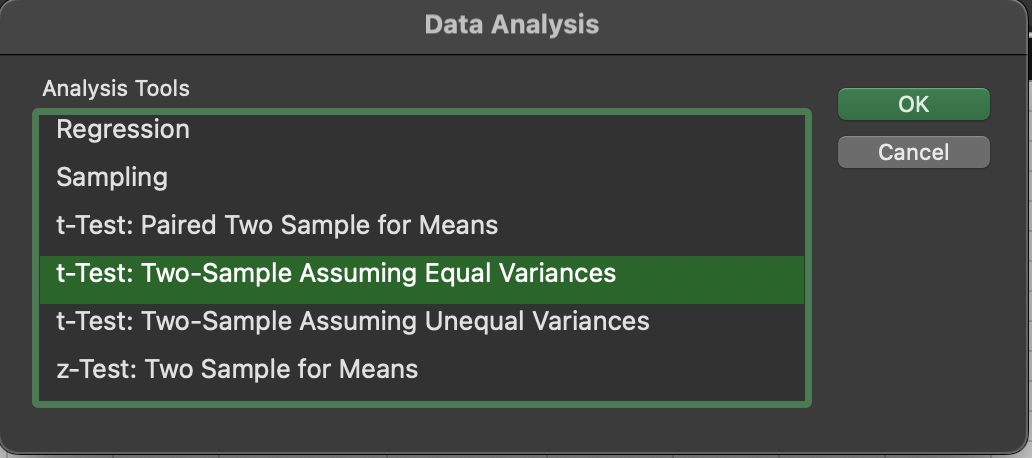
Note that one test assumes equal variances and the other assumes unequal variances. While there are statistical ways to test for equal versus unequal variance, you can get a quick idea by looking at a boxplot of the two groups. If the inter-quartile range (size of the box) is roughly similar between the two groups, then they likely have equal variance.
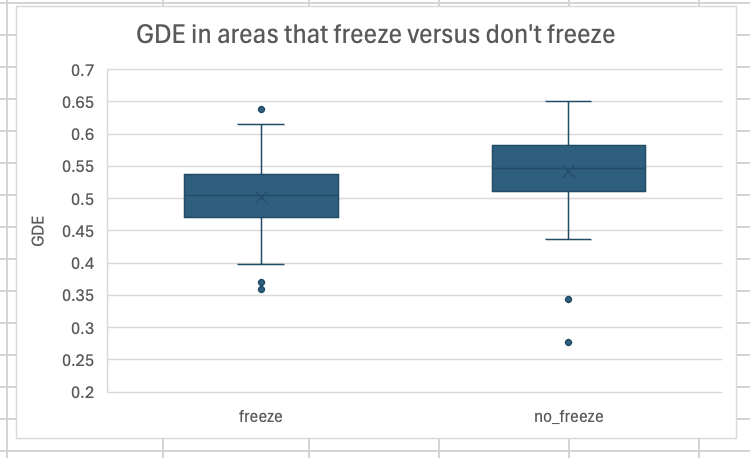
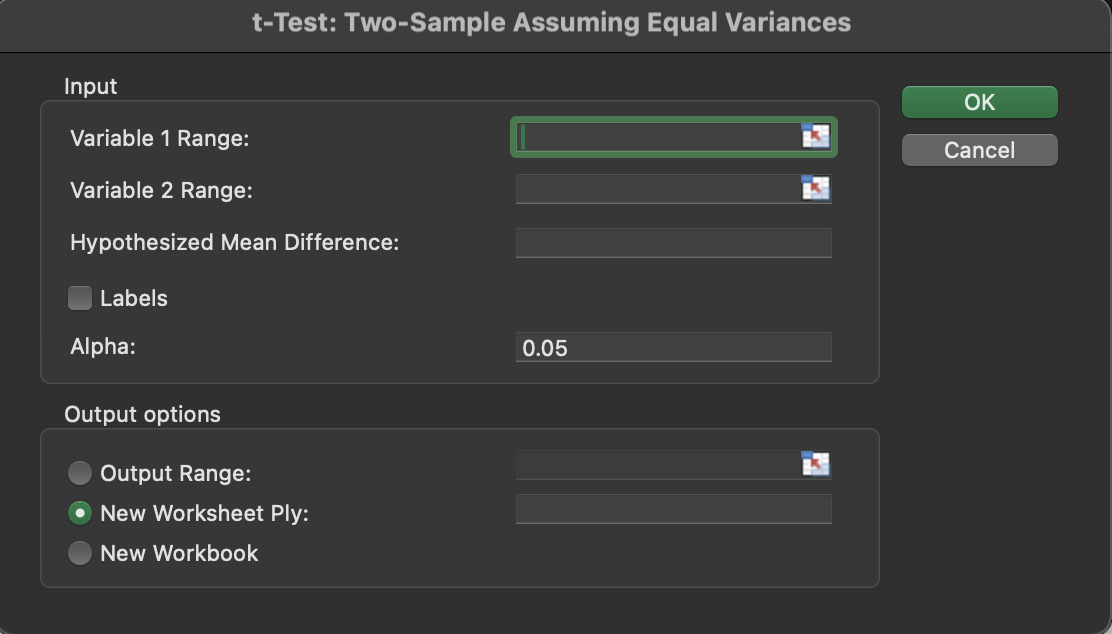
The IQR looks roughly the same between both groups, so you can use a two sample t-test assuming equal variance. After selecting the appropriate test, you need to select the range of data for the first variable and the second variable.
In this case, select the gde values that correspond with the freeze
label for the first variable and the gde values that correspond with
the no_freeze label for the second variable. You may want to sort the
data by freeze_class first to make this easier.
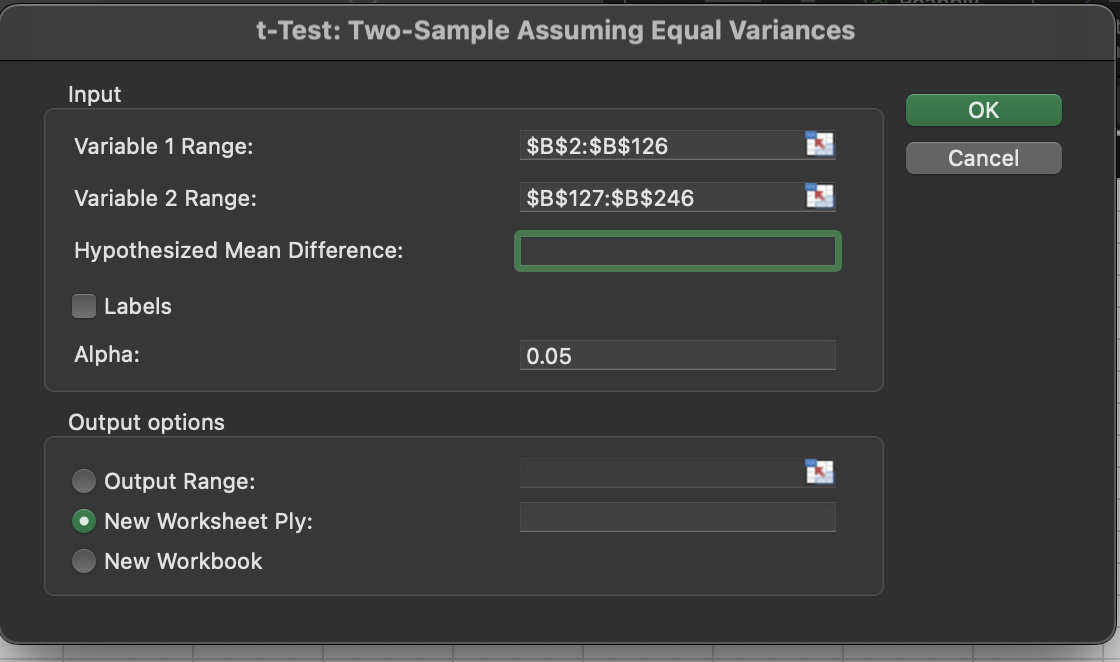
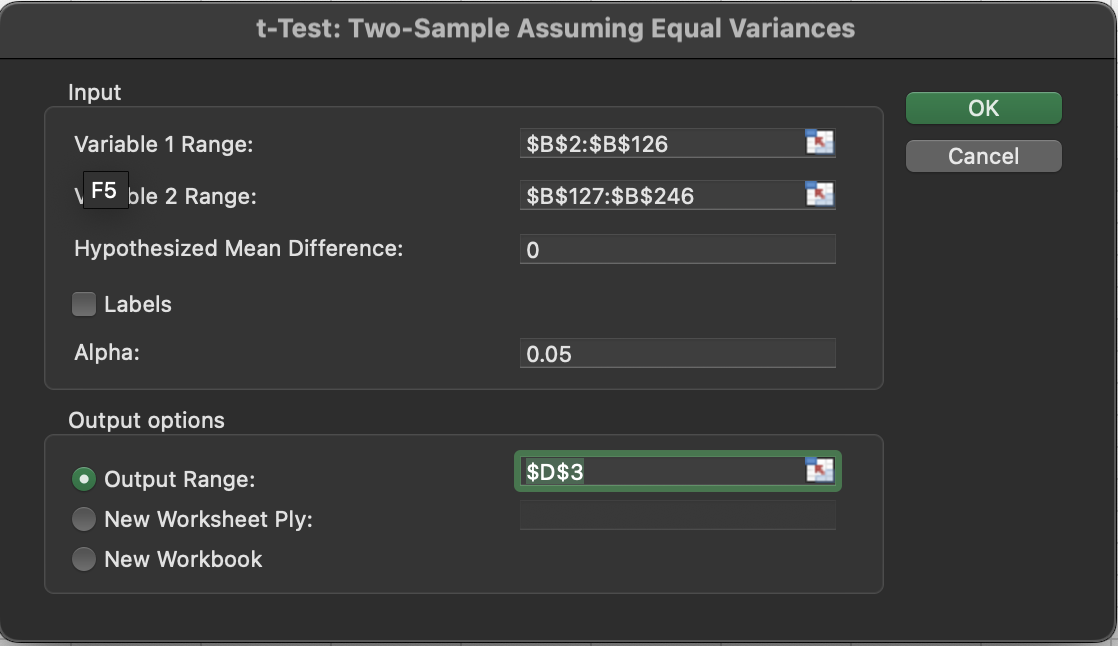
The hypothesized mean difference should be 0. This is your null hypothesis that there is no difference in means between the two groups. The alpha should remain at 0.05 and you can choose where you want the results output. I am keeping them in the same sheet.
The output table has quite a bit of information. The Mean, Variance, Observations, and Pooled Variance are descriptive statistics of the two groups. The Pooled Variance is a weighted average of the two group’s variances.
The “t Stat” is the t-statistic and there are p-values and critical
t-values for one-tailed and two-tailed hypotheses. One-tailed hypotheses
are for situations when one group is only either greater or smaller than
the other group, while two-tailed hypotheses are for situations when one
group only has to be different than the other. In this case we are
interested in if the two groups are different, so the p-value for the
two-tailed hypothesis is relevant (P(T<=t) two-tail).
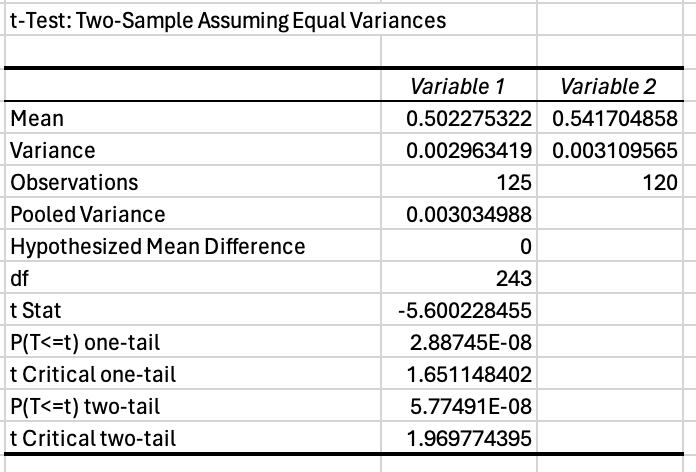
The p-value is way less than 0.05 (0.0000000577), so we can conclude that GDE is significantly different between places that freeze and places that don’t freeze!
For reporting, you can edit the table so that labels are clearer, for instance replacing “Variable 1” and “Variable 2” with the actual variable names.
Excel exercise
This week, you will conduct a round of two sample t-tests to test the
author’s hypothesis. The goal is to compare the number of minutes each
female spent off the nest (min_off) between the two treatments (Seet
and Chip) and the control (Silence). This will involve three t-tests:
-
Seet and Chip
-
Seet and Silence
-
Chip and Silence
Before conducting the t-tests, you have to decide whether to use a two
sample t-test assuming equal variance, or unequal variance. To do this,
make a boxplot of the three treatments, with min_off as the continuous
variable. Visually compare the size of the boxes to see if you can
assume equal variance for each of the t-tests. In summary, you need to:
- Make a boxplot of the three treatments, visually assessing the assumption of equal variance between the groups.
- Conduct two-sample t-tests for each pair of treatments.
Answer the following question about the data:
- What are the p-values of each t-test? Based on an alpha value of 0.05, do you reject or fail to reject the null hypothesis that there is no difference between each group (answer for each group)?
- Do these results support the authors’ hypothesis? Why or why not?
After you’re finished, upload the workbook and the lab worksheet to Blackboard.
References
Before you leave
Fill out the Weekly Feedback Form.
Lab materials inspired by Data Nuggets.