dss_2024
Insect genetic diversity across the globe
Featured scientist
Research Background
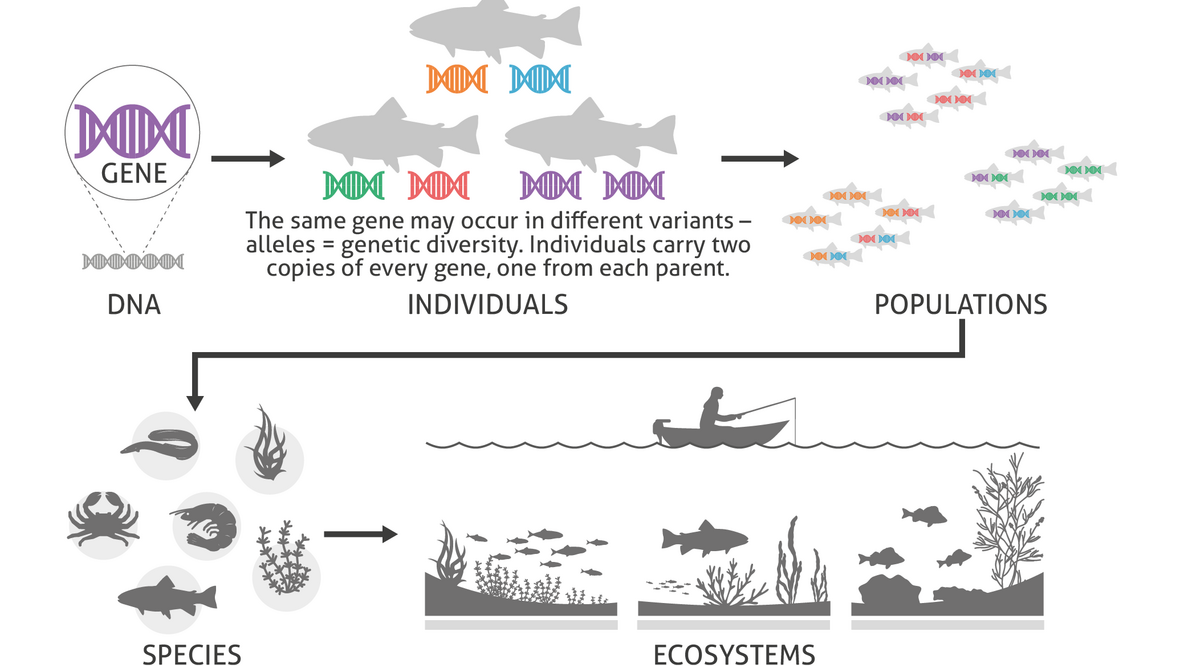
Biodiversity, the variety of life on Earth, faces significant threats worldwide, putting ecosystems at risk. Understanding and quantifying biodiversity are crucial steps in assessing this risk for the future and unraveling the processes that have shaped the world we see today. Biodiversity encompasses various dimensions, such as species richness, species abundances, and trait diversity. However, one often overlooked aspect is genetic diversity, which provides insights into recent evolutionary history.
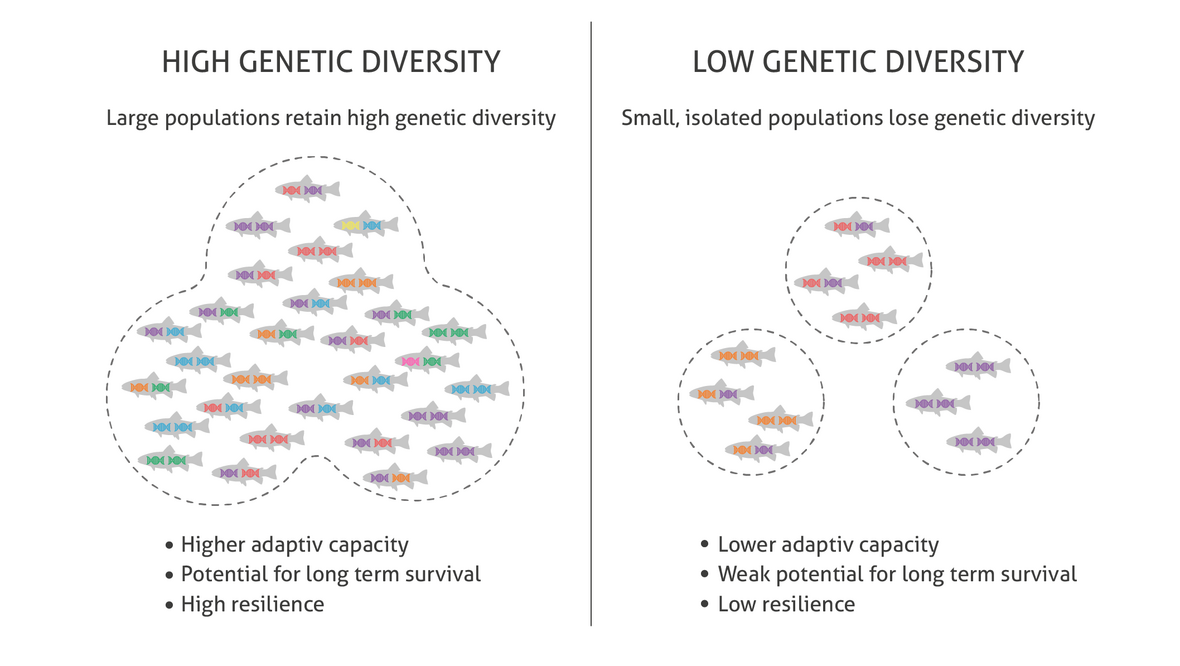
Understanding genetic diversity on a global scale is crucial for several reasons. Firstly, genetic diversity is the raw material for evolution, enabling species to adapt to changing environments and challenges. A diverse gene pool increases the chances of a population surviving threats such as diseases, climate change, or habitat loss. Additionally, genetic diversity can reveal patterns of migration, colonization, and historical events that have shaped current biodiversity. By studying genetic diversity globally, scientists can gain insights into the interconnectedness of ecosystems, identify vulnerable populations, and develop conservation strategies that preserve genetic variation essential for the long-term health and resilience of species and ecosystems. This comprehensive understanding of genetic diversity is fundamental for safeguarding biodiversity and ensuring the sustainability of life on Earth.
While much research has focused on vertebrates, insects, the most diverse group of animals, have received comparatively less attention. This is surprising given that insects play vital roles in ecosystems and are essential to human well-being. Exploring genetic diversity in insects can offer valuable perspectives on their evolutionary past and shed light on their critical ecological functions.
This is why Dr. Michael Hickerson and colleagues sought to understand what determines the genetic diversity of insect communities across the globe French et al. (2023). To pursue this question, they obtained gene sequences from over 2.4 million insects worldwide, using a publicly-available database. After dividing the planet into large, 193 x 193 km pixels, like a photograph with a very low resolution, they summarized the genetic diversity of all insects that fell within each pixel. They used a measurement called the genetic diversity evenness (GDE), which is a diversity measure- the higher the GDE, the higher the overall genetic diversity of the insect community.
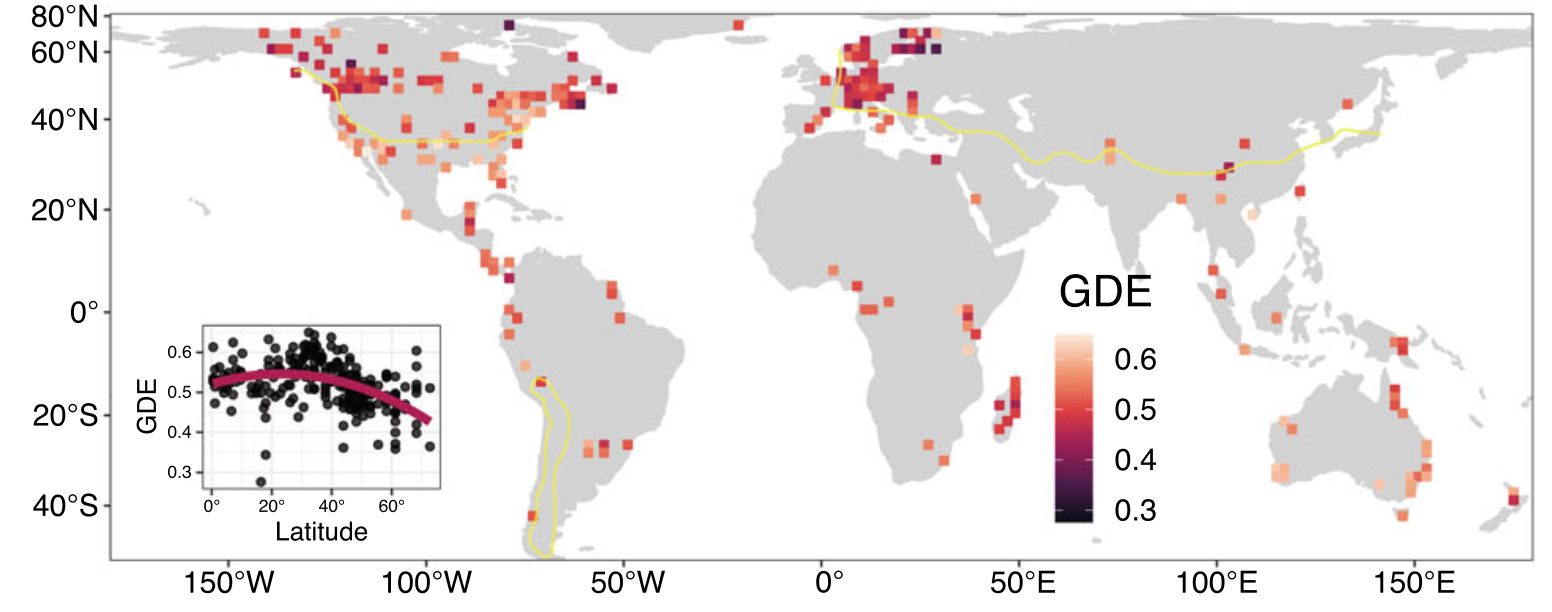
One prediction the authors made was that the GDE of insects is higher in areas that do not freeze during the year and lower in areas that do freeze. They believed that areas that do freeze have high seasonal temperature variation, making it difficult to reproduce consistently and maintain high levels of genetic diversity, while areas that do not freeze maintain a stable environment, leading to higher genetic diversity. In the figure above, areas north of the yellow line reach freezing temperatures, while areas south of the yellow line do not (at a coarse scale).
Scientific Question
How do seasonal temperature fluctuations influence the genetic diversity of insect communities across the globe?
Hypothesis
- State the authors’ hypothesis using the if… then… structure.
Scientific Data
| freeze_class | gde |
|---|---|
| freeze | 0.4714989 |
| freeze | 0.5863429 |
| freeze | 0.5091431 |
| freeze | 0.5775543 |
| freeze | 0.5135593 |
| no_freeze | 0.6132570 |
| no_freeze | 0.5101146 |
| no_freeze | 0.5262408 |
| no_freeze | 0.5140907 |
| no_freeze | 0.5163935 |
Table 1. A subset of the data used in the study. The ‘freeze_class’ column identifies whether an insect community that genetic diversity was calculated for falls in an area that freezes (‘freeze’) or does not freeze (‘no_freeze’). The ‘gde’ column is the genetic diversity evenness (GDE) of each insect community.
- What are the two treatment groups?
Descriptive statistics in Excel
This week you will get to apply your knowledge of pivot tables again! You only need a short exposition, since you aren’t learning a totally new skill.
The most common descriptive statistics (mean, standard deviation, max, min) can be efficiently summarized using a PivotTable in Excel. The only thing you need to do is select the appropriate summary from the Values section of your PivotTable editor.

Excel exercise
This week, you will create a PivotTable and data visualization for Dr. Hickerson’s data in Excel. You need to complete two tasks:
- You want to summarize your data to see if the average GDE is higher in areas that freeze or do not freeze. Create a Pivot Table that returns the averages of the “gde” column for each “freeze_class”, where the rows are the freeze_class and columns are average and standard deviation of GDE.
- Using the original data, make a boxplot comparing GDE between the two freeze classes.
Answer the following question about the data:
- Based on the Pivot Table and boxplot, is the hypothesis supported? Why?
After you’re finished, upload the workbook and the lab worksheet to Blackboard.
References
Before you leave
Fill out the Weekly Feedback Form.
Lab materials inspired by Data Nuggets.
Additional sources for background information: