dss_2024
Week 2, Blood parasites in New World vultures
Featured scientist
Research Background
Parasites rely on hosts for their reproduction and development, but hosts are negatively impacted by this interaction. Over generations, parasites adapt to better infect their hosts, while hosts adapt to resist infection. This leads to tightly intertwined evolutionary trajectories, known as host-parasite co-evolution. When hosts and parasites evolve together, it’s expected that closely related parasites will infect closely related hosts.
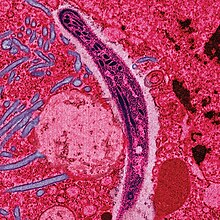
Haemosporidian (HEEM-OH-SPORE-IDIAN) parasites are a diverse group of parasites that infect blood cells. Included in this group is the genus Plasmodium, which transmit malaria. Their life cycle typically involves transmission to a host (e.g. humans or other vertebrate) by a vector (e.g. a mosquito), where the parasite develops in a body tissue like the liver before entering the blood stream and infecting blood cells.
While haemosporidians infect all major animal taxa (taxa are groups of organisms considered to be a unit, like “birds” or “mammals”), they are especially diverse with bird hosts. Host-parasite relationships in this group are well-known across most bird species, but knowledge about those that infect vultures is still very limited. That is why Dr. Susan Perkins and colleagues sought to understand the presence and diversity of haemosporidian parasites in vultures Yabsley et al. (2018).
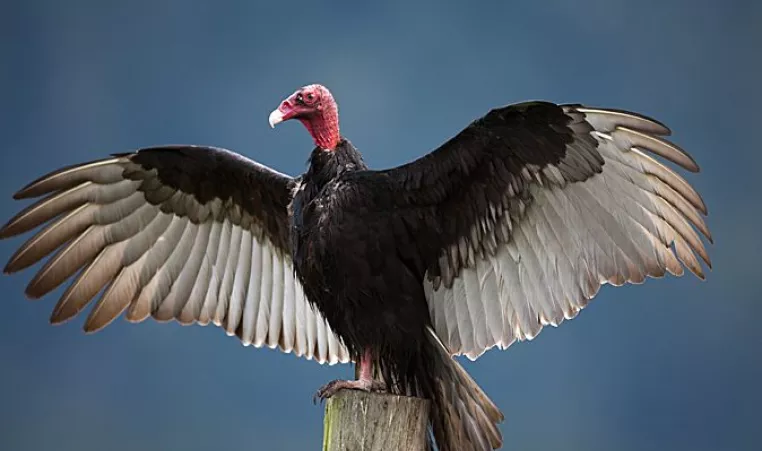
There are two main vulture taxa- New World vultures and Old World vultures. New World vultures are distributed in the Western Hemisphere, while Old World vultures are distributed in the Eastern Hemisphere. Dr. Perkins focused on New World vultures. New World vulture species are similar in appearance and in the functional role they play in the ecosystem as scavengers, but they have evolved unique physical and behavioral differences. Of the New World vultures, the turkey vultures (Cathartes aura) and black vultures (Coragyps atratus) are the most widespread, distributed from southern South America into the United States and even Canada in the case of turkey vultures. This led Dr. Perkins and colleagues chose to focus on these two species for their study.
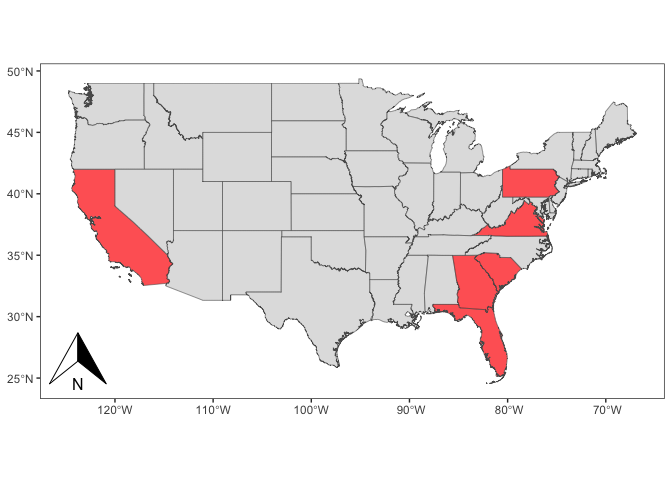
Dr. Perkins et al. (et al. is an abbreviation for “and others”) sampled blood and tissue from 165 turkey vultures and 95 black vultures in six US states. A representative subset of this data is represented in the data table (Table 1) and map (Figure 1) below. They extracted DNA from these samples and used a method called polymerase chain reaction (PCR) to amplify DNA strands that are known to be unique to haemosporidian parasites. With this technique they are able to accurately identify if a particular vulture is infected with a haemosporidian parasite or not. Dr. Perkins et al. then compared the number of turkey vultures infected with haemosporidians with the number of infected black vultures. They expected haemosporidians to be present in the blood of both vulture species, since they are closely related and play similar roles in the ecosystem. Moreover, they expected a similar relative number of individuals to be infected in both species.
Although you are not looking at this data today, they also used the DNA and physical features of the parasites to describe the evolutionary diversity of the sampled haemosporidians. They wanted to see how it compared with existing knowledge of blood parasite evolutionary diversity!
Scientific Question
**1.** ***Based on the background information provided, what is the question Dr. Perkins et al. are asking in their study?***
Next, let’s glance at the data they collected to better understand the hypothesis they wanted to test.
Scientific Data
| Species | State | Sample type | PCR |
|---|---|---|---|
| Turkey vulture | California | blood | negative |
| Turkey vulture | California | blood | positive |
| Turkey vulture | California | blood | negative |
| Turkey vulture | California | tissue | negative |
| Turkey vulture | Florida | tissue | positive |
| Turkey vulture | Florida | blood | negative |
| Turkey vulture | Florida | blood | negative |
| Turkey vulture | Florida | blood | negative |
| Turkey vulture | Georgia | blood | negative |
| Turkey vulture | Georgia | tissue | negative |
| Turkey vulture | Georgia | blood | negative |
| Turkey vulture | Pennsylvania | blood | positive |
| Turkey vulture | Pennsylvania | blood | negative |
| Turkey vulture | South Carolina | blood | positive |
| Turkey vulture | South Carolina | blood | positive |
| Turkey vulture | South Carolina | blood | negative |
| Turkey vulture | Virginia | blood | positive |
| Turkey vulture | Virginia | tissue | negative |
| Turkey vulture | Virginia | blood | negative |
| Turkey vulture | Virginia | blood | negative |
| Black vulture | Georgia | blood | negative |
| Black vulture | Georgia | tissue | negative |
| Black vulture | Georgia | blood | negative |
| Black vulture | South Carolina | blood | negative |
| Black vulture | South Carolina | blood | negative |
| Black vulture | South Carolina | blood | negative |
| Black vulture | Virginia | blood | negative |
| Black vulture | Virginia | blood | negative |
| Black vulture | Virginia | blood | negative |
Table 1. Results of haemosporidian detection on New World vultures from the United States, adapted from Yabsley et al. 2018.
Hypothesis
**2.** ***From the background information, data table, and figure, what hypothesis are they testing?***
**3.** ***Based on this hypothesis and the data table, what are the dependent and independent variables being used to answer this hypothesis?*** Note- there is only one dependent variable, but there can be one or more independent variables.
***Dependent variable:***
***Independent variable(s):***
Excel exercise
Data entry, while often tedious, is an important skill that demands concentration. However, there are techniques which can help you streamline the process! Below are techniques to quickly navigate and fill in data. These will help you with today’s Excel assignment and all future data entry and analysis tasks!
Navigating an Excel sheet
The spreadsheet used for this exercise is available for download here.
You can navigate around your sheet by clicking, or you can deftly
maneuver around your spreadsheet using your keyboard. After clicking on
a cell, you can use the left, right, up and down arrows (⬅️➡️⬆️⬇️) on
your keyboard to navigate cell-by-cell in any of those directions. Where
the true power of navigating with your keyboard comes in is through
using ctrl/cmd + ⬅️➡️⬆️⬇️ to skip to the farthest extents of your
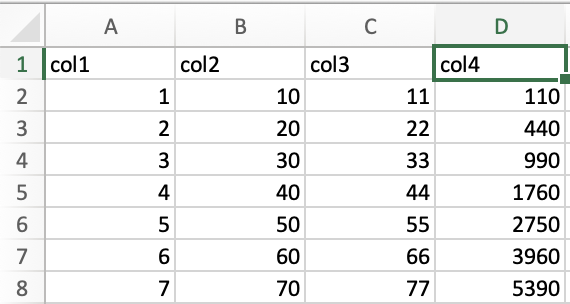
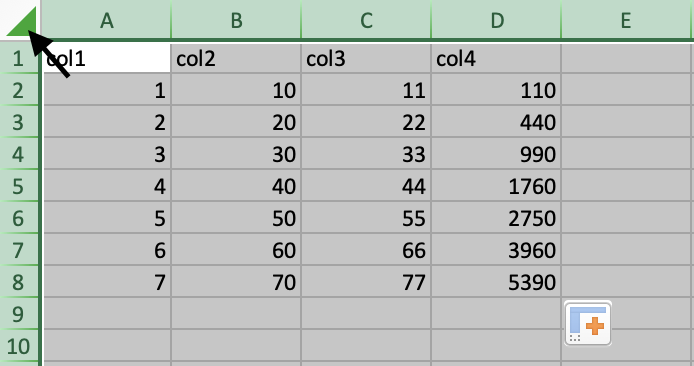
spreadsheet instantly. For instance, starting with cell A1 in the
following spreadsheet:
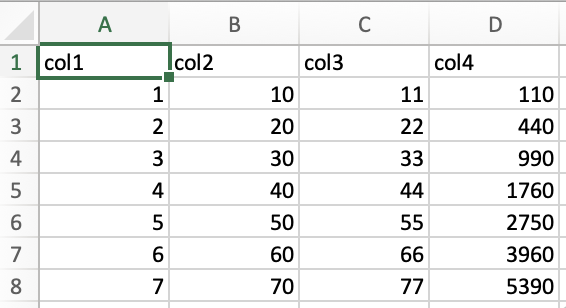
Pressing ctrl/cmd + ➡️ immediately transfers you to cell D1.
This is most powerful when combined with selecting ranges of data, which is outlined in the next section.
Selecting data
The most basic way to select a single cell is by clicking on the desired
cell. To select multiple cells, you can use ctrl/cmd + click. You need
to hold ctrl/cmd down for every cell that you click on to select all
of them.
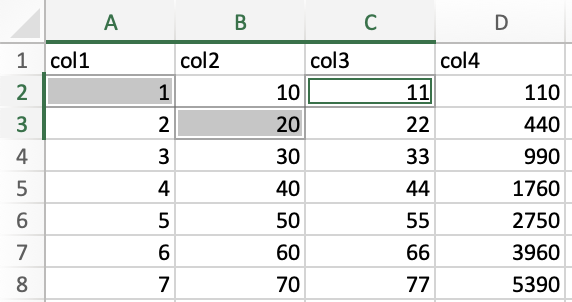
For instance, I held down ctrl/cmd and clicked on cells A2, B3,
and C2 in the following example.
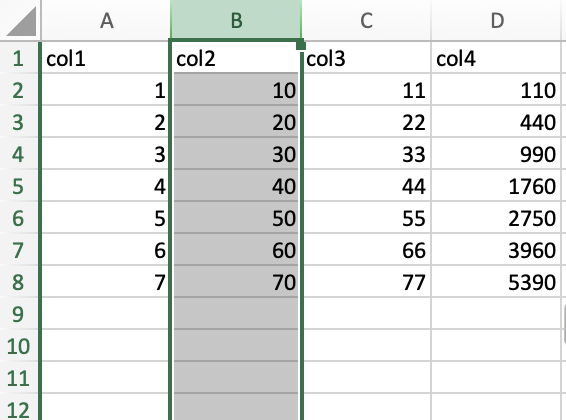
To select an entire column, click on the column letter. For instance, I clicked the column letter B to select column B. Note, the selection extends beyond the range of my data in the spreadsheet, which is normal.
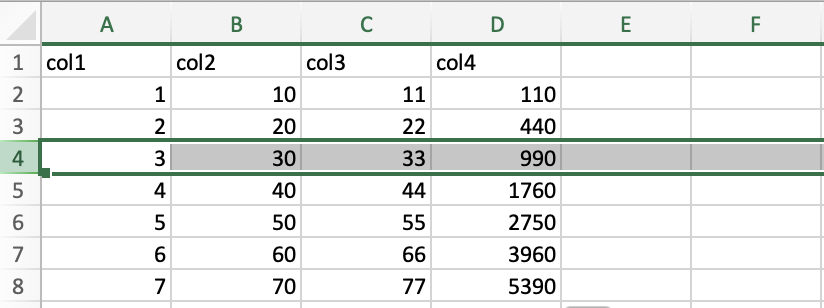
Similarly, to select a row in the spreadsheet, you should click on the row number. Here, I clicked on row 4 to select the entire row.
To select the whole spreadsheet, click on the triangle in the top-left corner of the spreadsheet.
Finally, you can select ranges in the data using two main methods: the
“click and drag” method and the keyboard method. But first, let’s
examine how a range of data is indicated. In the image below, the range
of the selected data is A1:C6.
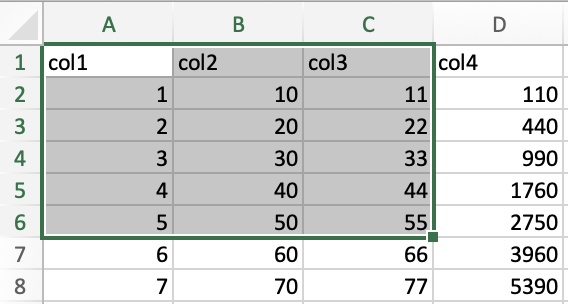
The top left corner is indicated by the first index, while the bottom right corner is indicated by the second index.
The “click and drag” method is convenient for selecting moderate ranges of data, where you click on the cell where you want to begin, hold the click, and drag your mouse across the range of data that you would like to select. It’s difficult to display in a static medium, so ask me if you’re confused.
The keyboard method is useful for selecting a variety of ranges of data.
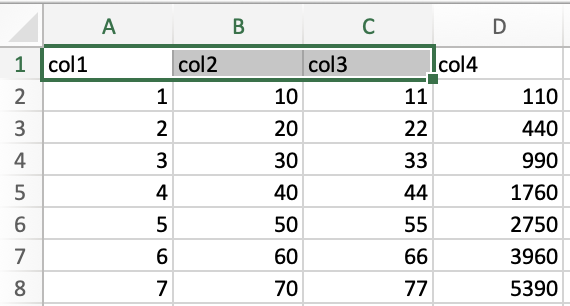
To select a small range of data, click on the cell where you want to
begin, press shift and hold shift down while you navigate with your
keyboard arrows. For instance, in the following example I clicked on
cell A1, held shift, and pressed ➡️ twice to select the range
A1:C1.
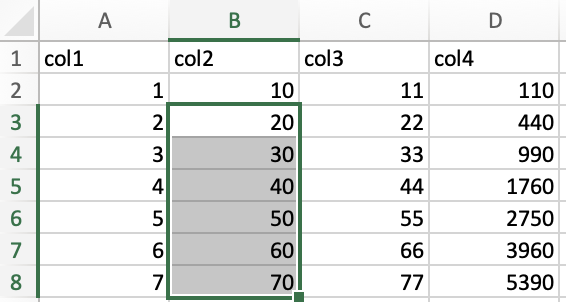
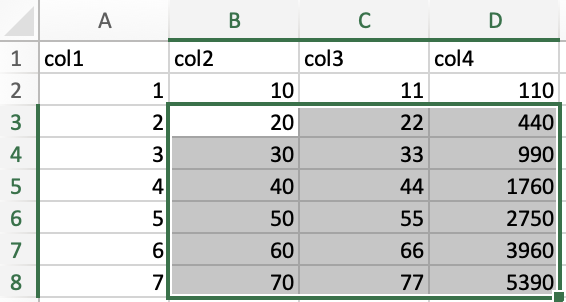
To select ranges of data that span to the edges of your data set, you
will click on your desired starting point, hold shift + ctrl/cmd, and
press a keyboard arrow. For instance, to select the range B3:B8 in the
following example, I clicked on B3, held shift + ctrl/cmd, then
pressed ⬇️.
The keyboard method is especially powerful as you combine keystrokes.
For instance, I expanded the above selection to include the range
B3:D8 by pressing ➡️ while still holding down shift + ctrl/cmd.
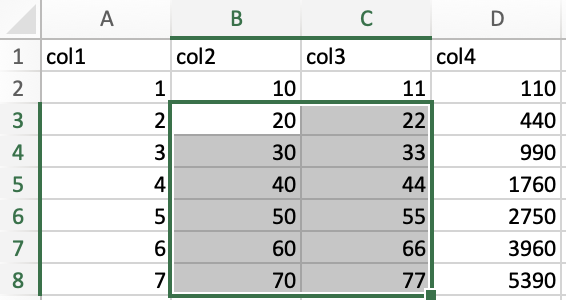
You can even de-select data by pressing an arrow in the direction of the
data you want to de-select. For instance, I de-selected the data in
column D from the above selection by holding shift and pressing
⬅️.
You can become a data selection wizard by combining the “click and drag” method with the keyboard method to rapidly navigate and choose the data you need!
Filling data
Filling data makes data entry much easier by filling ranges with values, so you don’t have to type in every single value.
To learn about filling data, I will direct you to w3schools, who provide an excellent introduction to the subject.
Excel assignment
**4. *Take the table of data used in Dr. Susan Perkin’s study (Table 1) and enter it into an Excel workbook.*** Use the skills you learned today to make this task easier! Upload the spreadsheet to Blackboard before the next lab period.
Data analysis
There are two main approaches to interpreting quantitative data- data visualization and statistics. You will learn some basic statistics in future labs, but for now you will focus on interpreting data visualizations.
Interpret the data
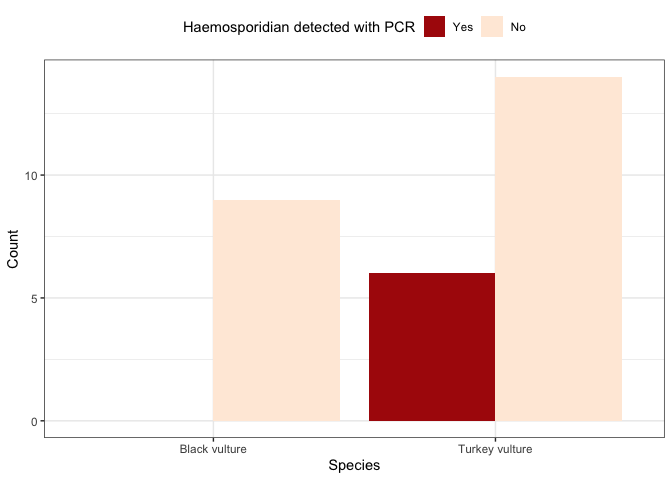
**5.** ***Based on the bar plot above, what can you say about your hypothesis? Is it supported or not supported? Why?***
Next steps as a scientist
Science is never finished. Every answer leads to new questions, and perhaps more importantly to remember, not every answer is the final answer. Keeping this in mind,
**6. *What new question do you think should be investigated and why? If the new question requires new data, what data should be collected and why?***
References
Before you leave
Fill out the Weekly Feedback Form.
Excel materials inspired or sourced from W3Schools. Lab materials inspired by Data Nuggets.