dss_2024
Lab Introduction
Who I am
Scientist
My name is Connor French (call me Connor) and I’m a sixth year PhD candidate in Biology- Ecology, Evolution, and Behavior! I’m advised by Dr. Mike Hickerson and unofficially co-advised by Dr. Ana Carnaval. Outside of my research I enjoy spending time outside with my dog, playing music, and film photography!
Science
I study how populations, species, and communities evolve in response to changing environments. My research has mainly centered around how population sizes and connectivity change in response to large historical climate shifts across the late Pleistocene and Holocene (~129,000 years ago to the present day) and what impact this has on species and communities. Most of my research is conducted on tropical reptiles and amphibians because they are what excite me the most, but I do work on other animals and in other areas- for instance, I recently published a paper mapping the genetic diversity of insects across the globe. I consider my research important because it offers a glimpse into how species and communities made it to where they are now, it provides a baseline to predict where they may go in the future, and perhaps most critically, whether they will survive into the future.
I use a combination of field work, lab work, and computational work to answer the questions I’m interested in. Because fossils are few and far between, I sequence the DNA of lizards and frogs across their current geographic ranges to understand their pasts. DNA contains the history of an organism’s ancestry, and even can tell us the history of entire populations- how a population may have shrank or expanded in the past and whether they exchanged migrants with other populations. After I have collected the organisms in the field and sequenced their DNA in the lab, I analyze the data on a computer. I use everything from my personal laptop to a super computer at the American Museum of Natural History to run my analyses. I use a combination of statistics, machine learning, and simulations to tease apart the potential ecological and evolutionary forces driving the patterns that I observe.


Data
In addition to DNA sequences, I use ecological information to inform my analyses. I aggregate records of where the lizards or frogs I study have been observed and used that to obtain ecological information from online databases. For instance, if I want to get a broad understanding of the environmental tolerances of the tree frogs I study, I take the locations where they have been observed, extract the average annual temperature and precipitation of these locations from the online database, and summarize those values using measurements like the average or spread of those values. I can compare these ecological measurements between species or populations to see how their ecological tolerances differ and how they might change over time!
Here’s an illustration of the process:
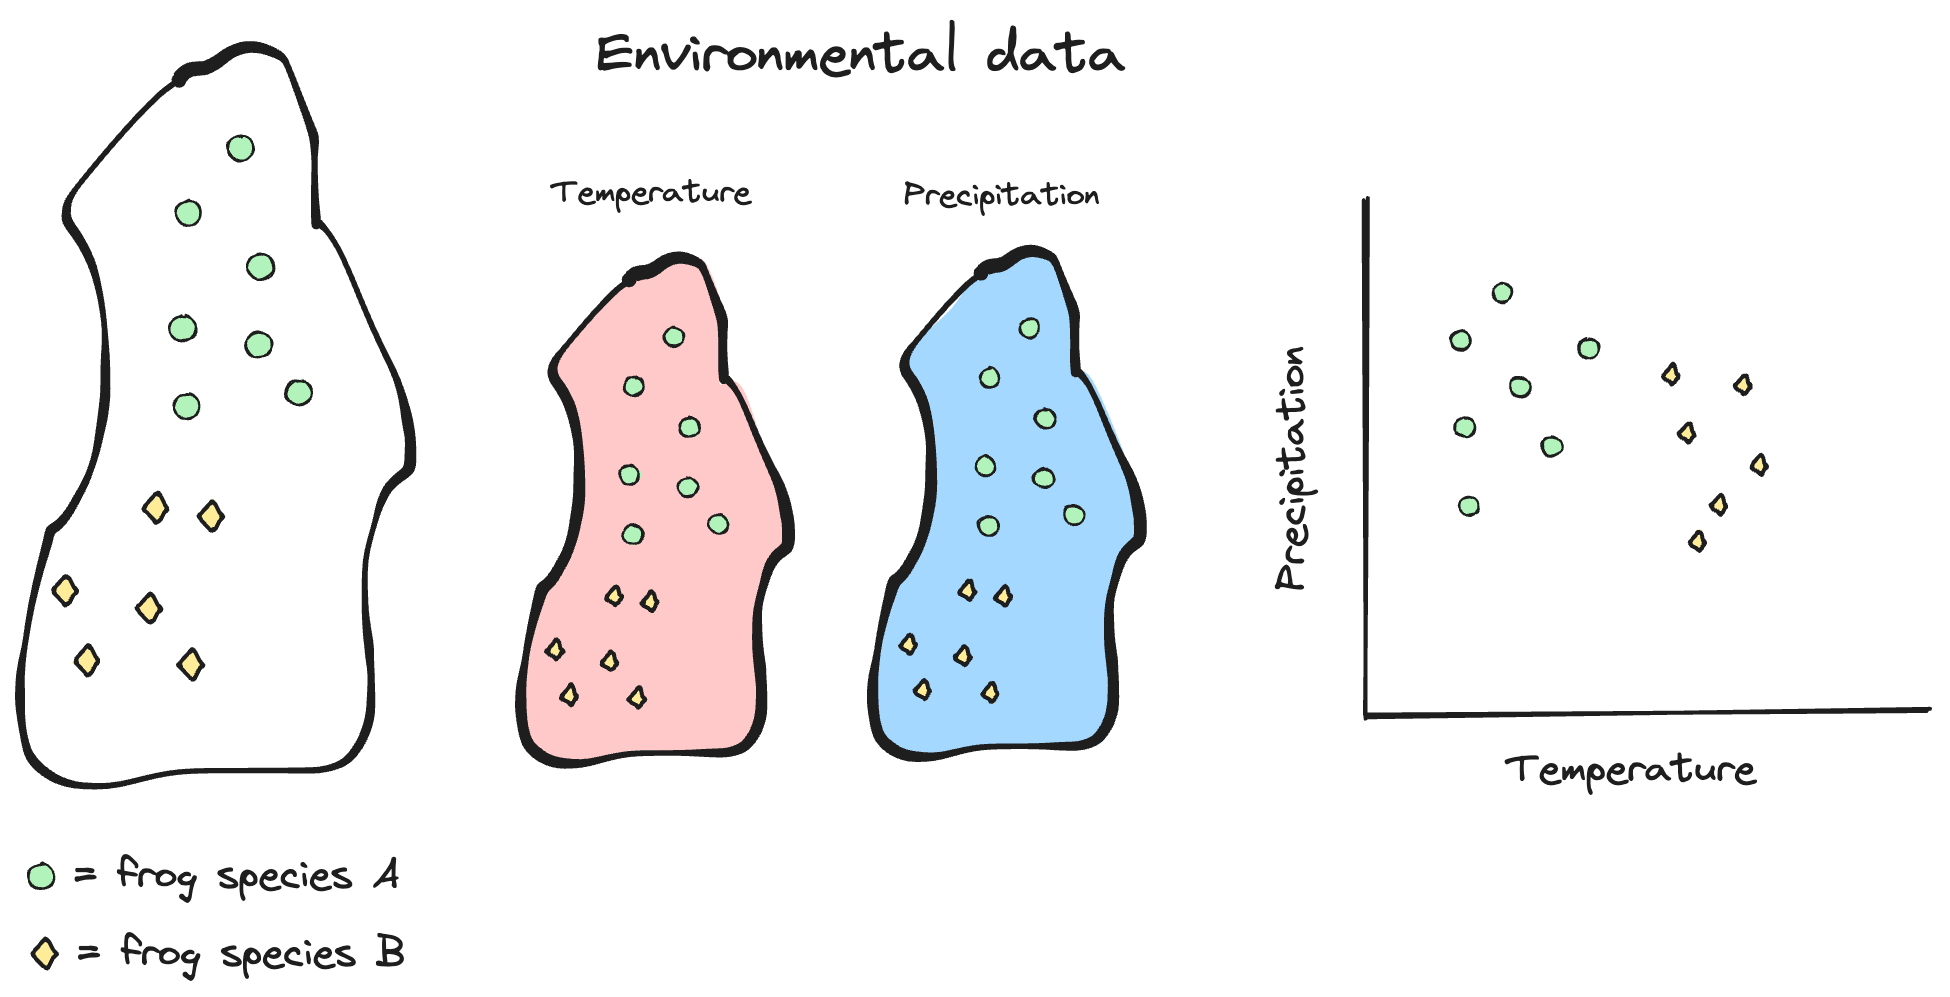
It looks like frog species A likes it a bit cooler and wetter than frog species B!
Purpose of the lab
The lab portion of the course is mainly devoted to goals (2) and (3) from the syllabus:
(2) use exploration and experiential problem-solving to become familiar with how scientists ask questions, collect data, and analyze it to further knowledge; and 3) develop core technological skills in Microsoft Excel and the statistical programming language R to kick-start their success in future science courses and labs and research endeavors
We will use real data from the scientists you meet during the lecture portion to satisfy these goals!
Learning outcomes
What you tackle during the lab will contribute to all of the learning outcomes stated in the syllabus.
1. Explain how undertaking biological research differs from studying biology in a classroom. 2. Understand the diverse backgrounds from which scientists come. 3. Understand research fundamentals. 4. Understand advanced functions of Microsoft Excel. 5. Manipulate data and undertake analysis in the R statistical computing language.
How a lab will typically go
Labs will have a “Data Science” section and an “Excel/R” section. The Data Science section will cover research methods, scientific techniques, and feedback on your group projects (we will go over your group projects next week!). The Excel/R section will familiarize you with the two pieces of software and cover hands-on data recording and analysis using real data from the presenters!
Each week will involve working through a research question involving data from that week’s presenter, where you will evaluate or ask your own scientific question, form hypotheses, investigate research data, visualize and analyze the data, and interpret your analyses. The lab will focus on particular Data Science and Excel/R concepts specific to that week.
Semester outline
We have a tentative schedule for what the lab will cover, but it is subject to change depending on how I feel y’all are progressing. This is the first time this class is being taught, so I will be learning from you just like you will be learning from me!
| Week | Lecture Date | Lecture Day | Speaker | Lab Date | Lab Day | Topic |
| 1 | Jan 29 | Mon | First class | Jan 31 | Wed | Introduction/Excel overview |
| 2 | Feb 5 | Mon | Susan Perkins | Feb 7 | Wed | Experiment components/Entering data |
| 3 | Feb 12 | Mon | Lincoln’s Birthday | Feb 14 | Wed | Projects/Formula basics |
| 4 | Feb 19 | Mon | President’s Day | |||
| 5 | Feb 21 | Wed | Shubha Govind | Feb 22 | Thu | (Mon schedule). Data ethics/Import & clean data |
| 6 | Feb 26 | Mon | David Lohman | Feb 28 | Wed | (Mon schedule). Experimental design/Sorting data |
| 7 | Mar 4 | Mon | Bao Vuong | Mar 6 | Wed | Data visualization |
| 8 | Mar 11 | Mon | Mark Emerson | Mar 13 | Wed | Filtering data |
| 9 | Mar 18 | Mon | David Jeruzalmi | Mar 20 | Wed | Project check-in/Tables |
| 10 | Mar 25 | Mon | Mike Hickerson | Mar 27 | Wed | Descriptive statistics |
| 11 | April 1 | Mon | Mark Hauber | Apr 3 | Wed | Intro to coding/R |
| 12 | Apr 8 | Mon | Rob Anderson | April 10 | Wed | Functions/Data structures |
| 13 | Apr 15 | Mon | Jay Edelman | April 17 | Wed | Data visualization |
| 14 | Apr 22 | Mon | Spring Break | |||
| 15 | Apr 29 | Mon | Spring Break | May 1 | Wed | Project check-in/Statistics |
| 16 | May 6 | Mon | Karin Block | May 8 | Wed | Putting everything together |
| 17 | May 13 | Mon | Student Presentations | May 15 | Wed | Presentations |
Grading
| The final grade will be calculated as follows: | |
| Attendance | 20% |
| Lab assignments | 60% |
| Final projects | 20% |
You will have 12 lab assignments, worth 5 points each. Each lab assignment will be due before the following lab section. I will accept labs one day late for 2 point deduction, but more than one day late results in a zero. You will have opportunities throughout the semester to earn extra credit.
The final project will be a group research project that culminates in a final presentation. I will give more details on the final project on week 3.
Blackboard
All lab materials will be hosted on Blackboard. Your grades will be posted there as well. I send emails to the class through Blackboard, so make sure to check your email that’s associated with Blackboard!
Excel introduction
Installation
If you do not have installed Microsoft Office 365 installed on your computer, follow City College’s instructions to install the latest version (for free).
What is Excel?
It is a spreadsheet program developed by Microsoft. Excel organizes data in columns and rows and allows you to do mathematical functions. It runs on Windows, macOS, Android and iOS.
Why use Excel?
- Everyone uses it. Scientists, finance professionals, fantasy football players, DnD dungeon masters, you name it.
- It has a low barrier to entry.
- It is versatile- there are many tools that Microsoft and other developers have made to make different tasks like data analysis and accounting easier.
- There is a lot of advanced functionality that you can access as you learn more
- There is a lot of community support
Navigating Excel
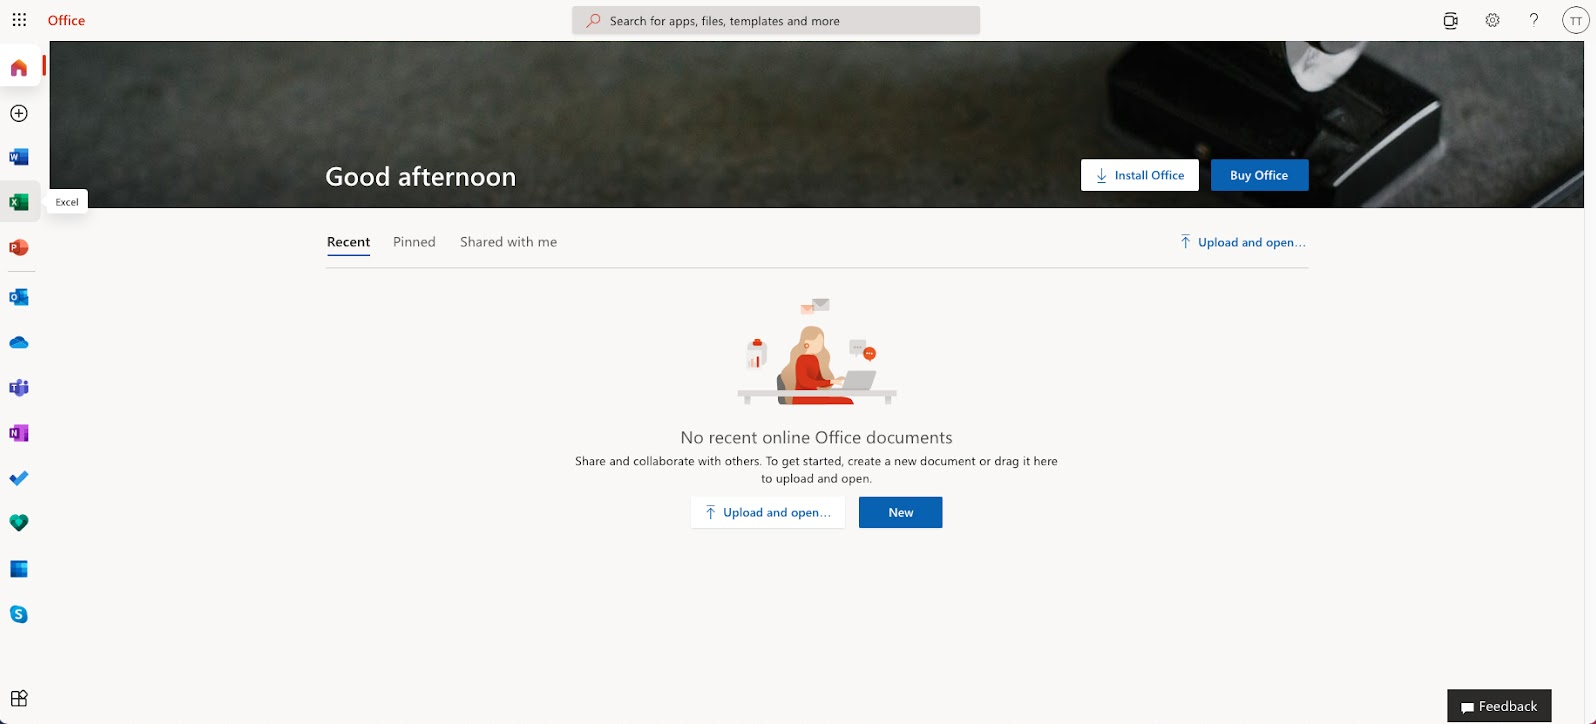
After you have logged on through www.office.com, click on the Excel icon to enter Excel.
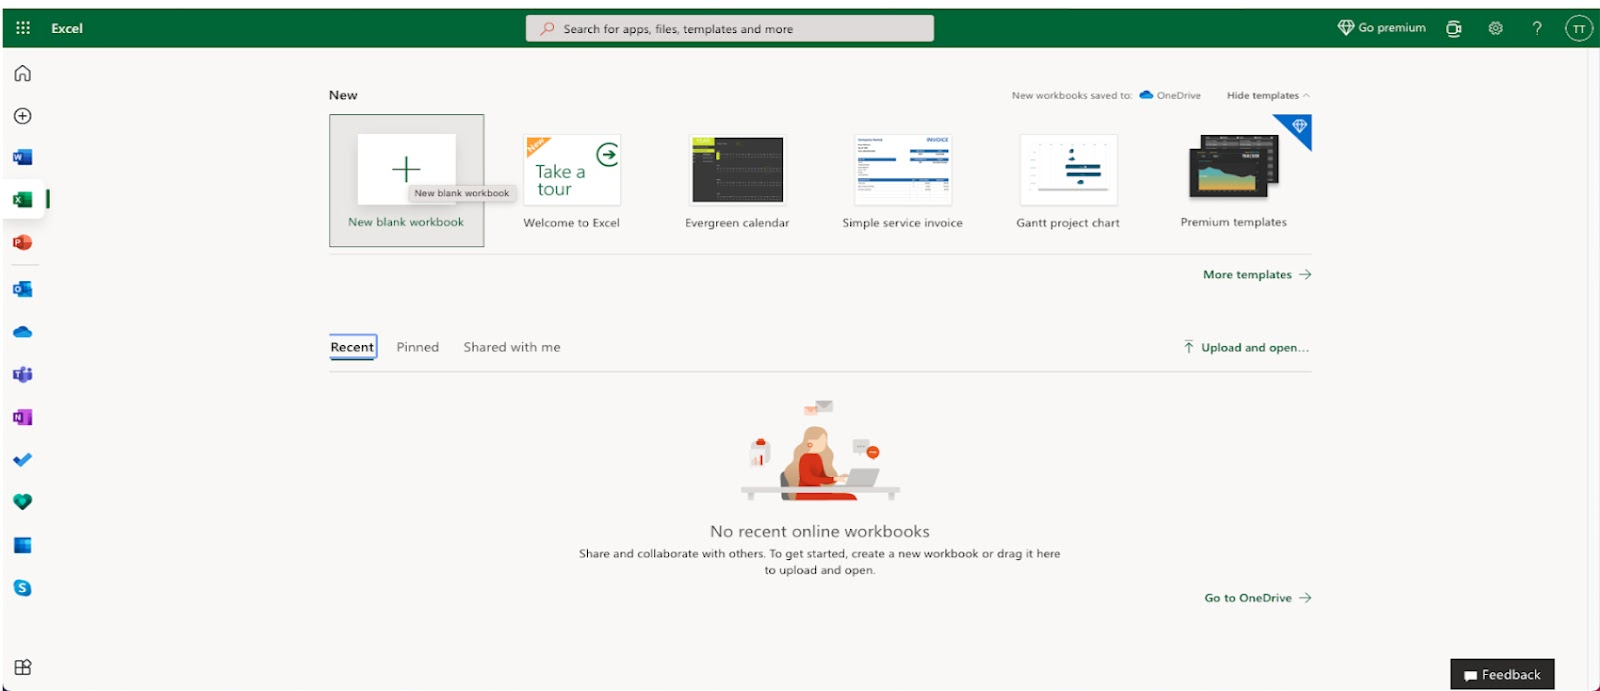
After entering Excel, click on the New blank workbook button to open a new workbook
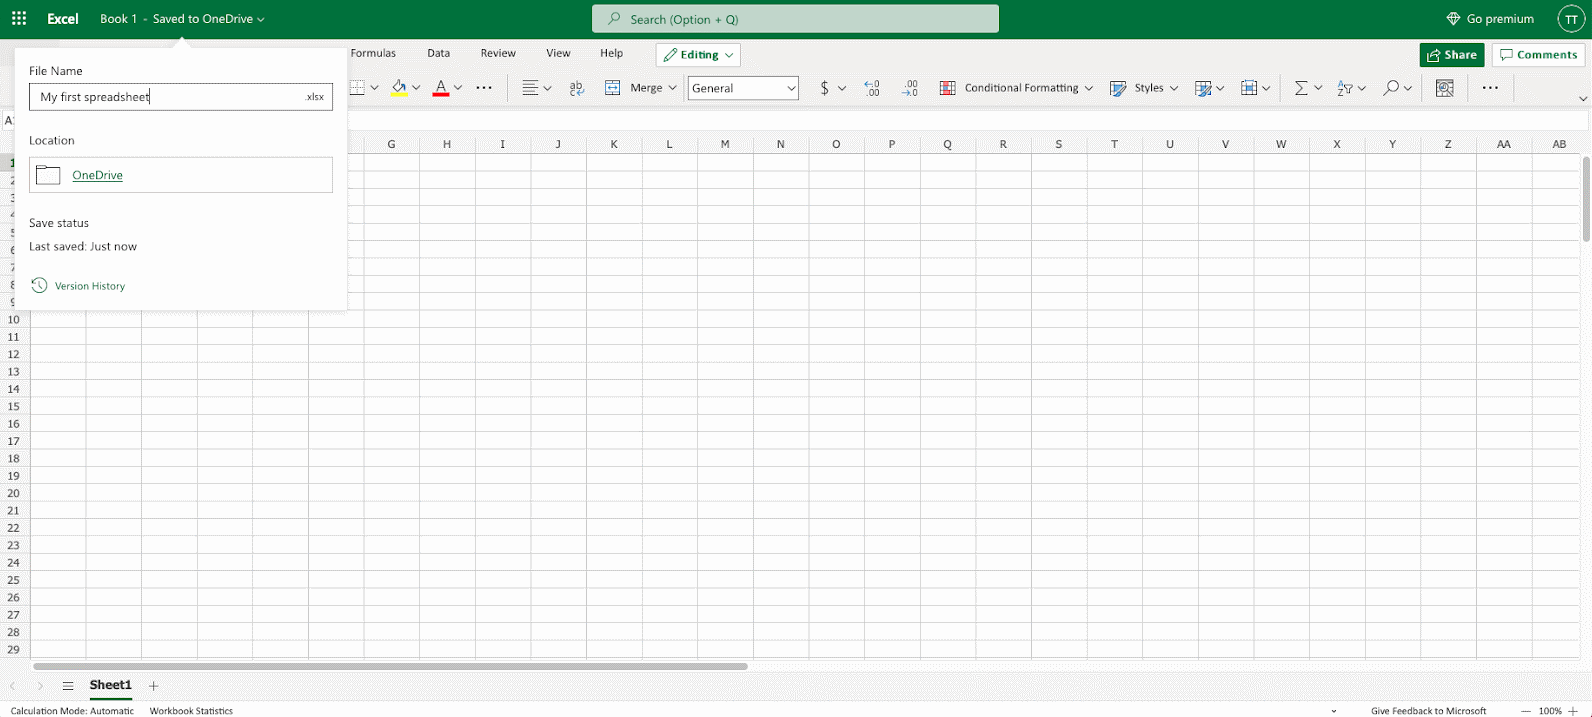
Enter a name for the workbook (call it whatever you like) and hit Enter.
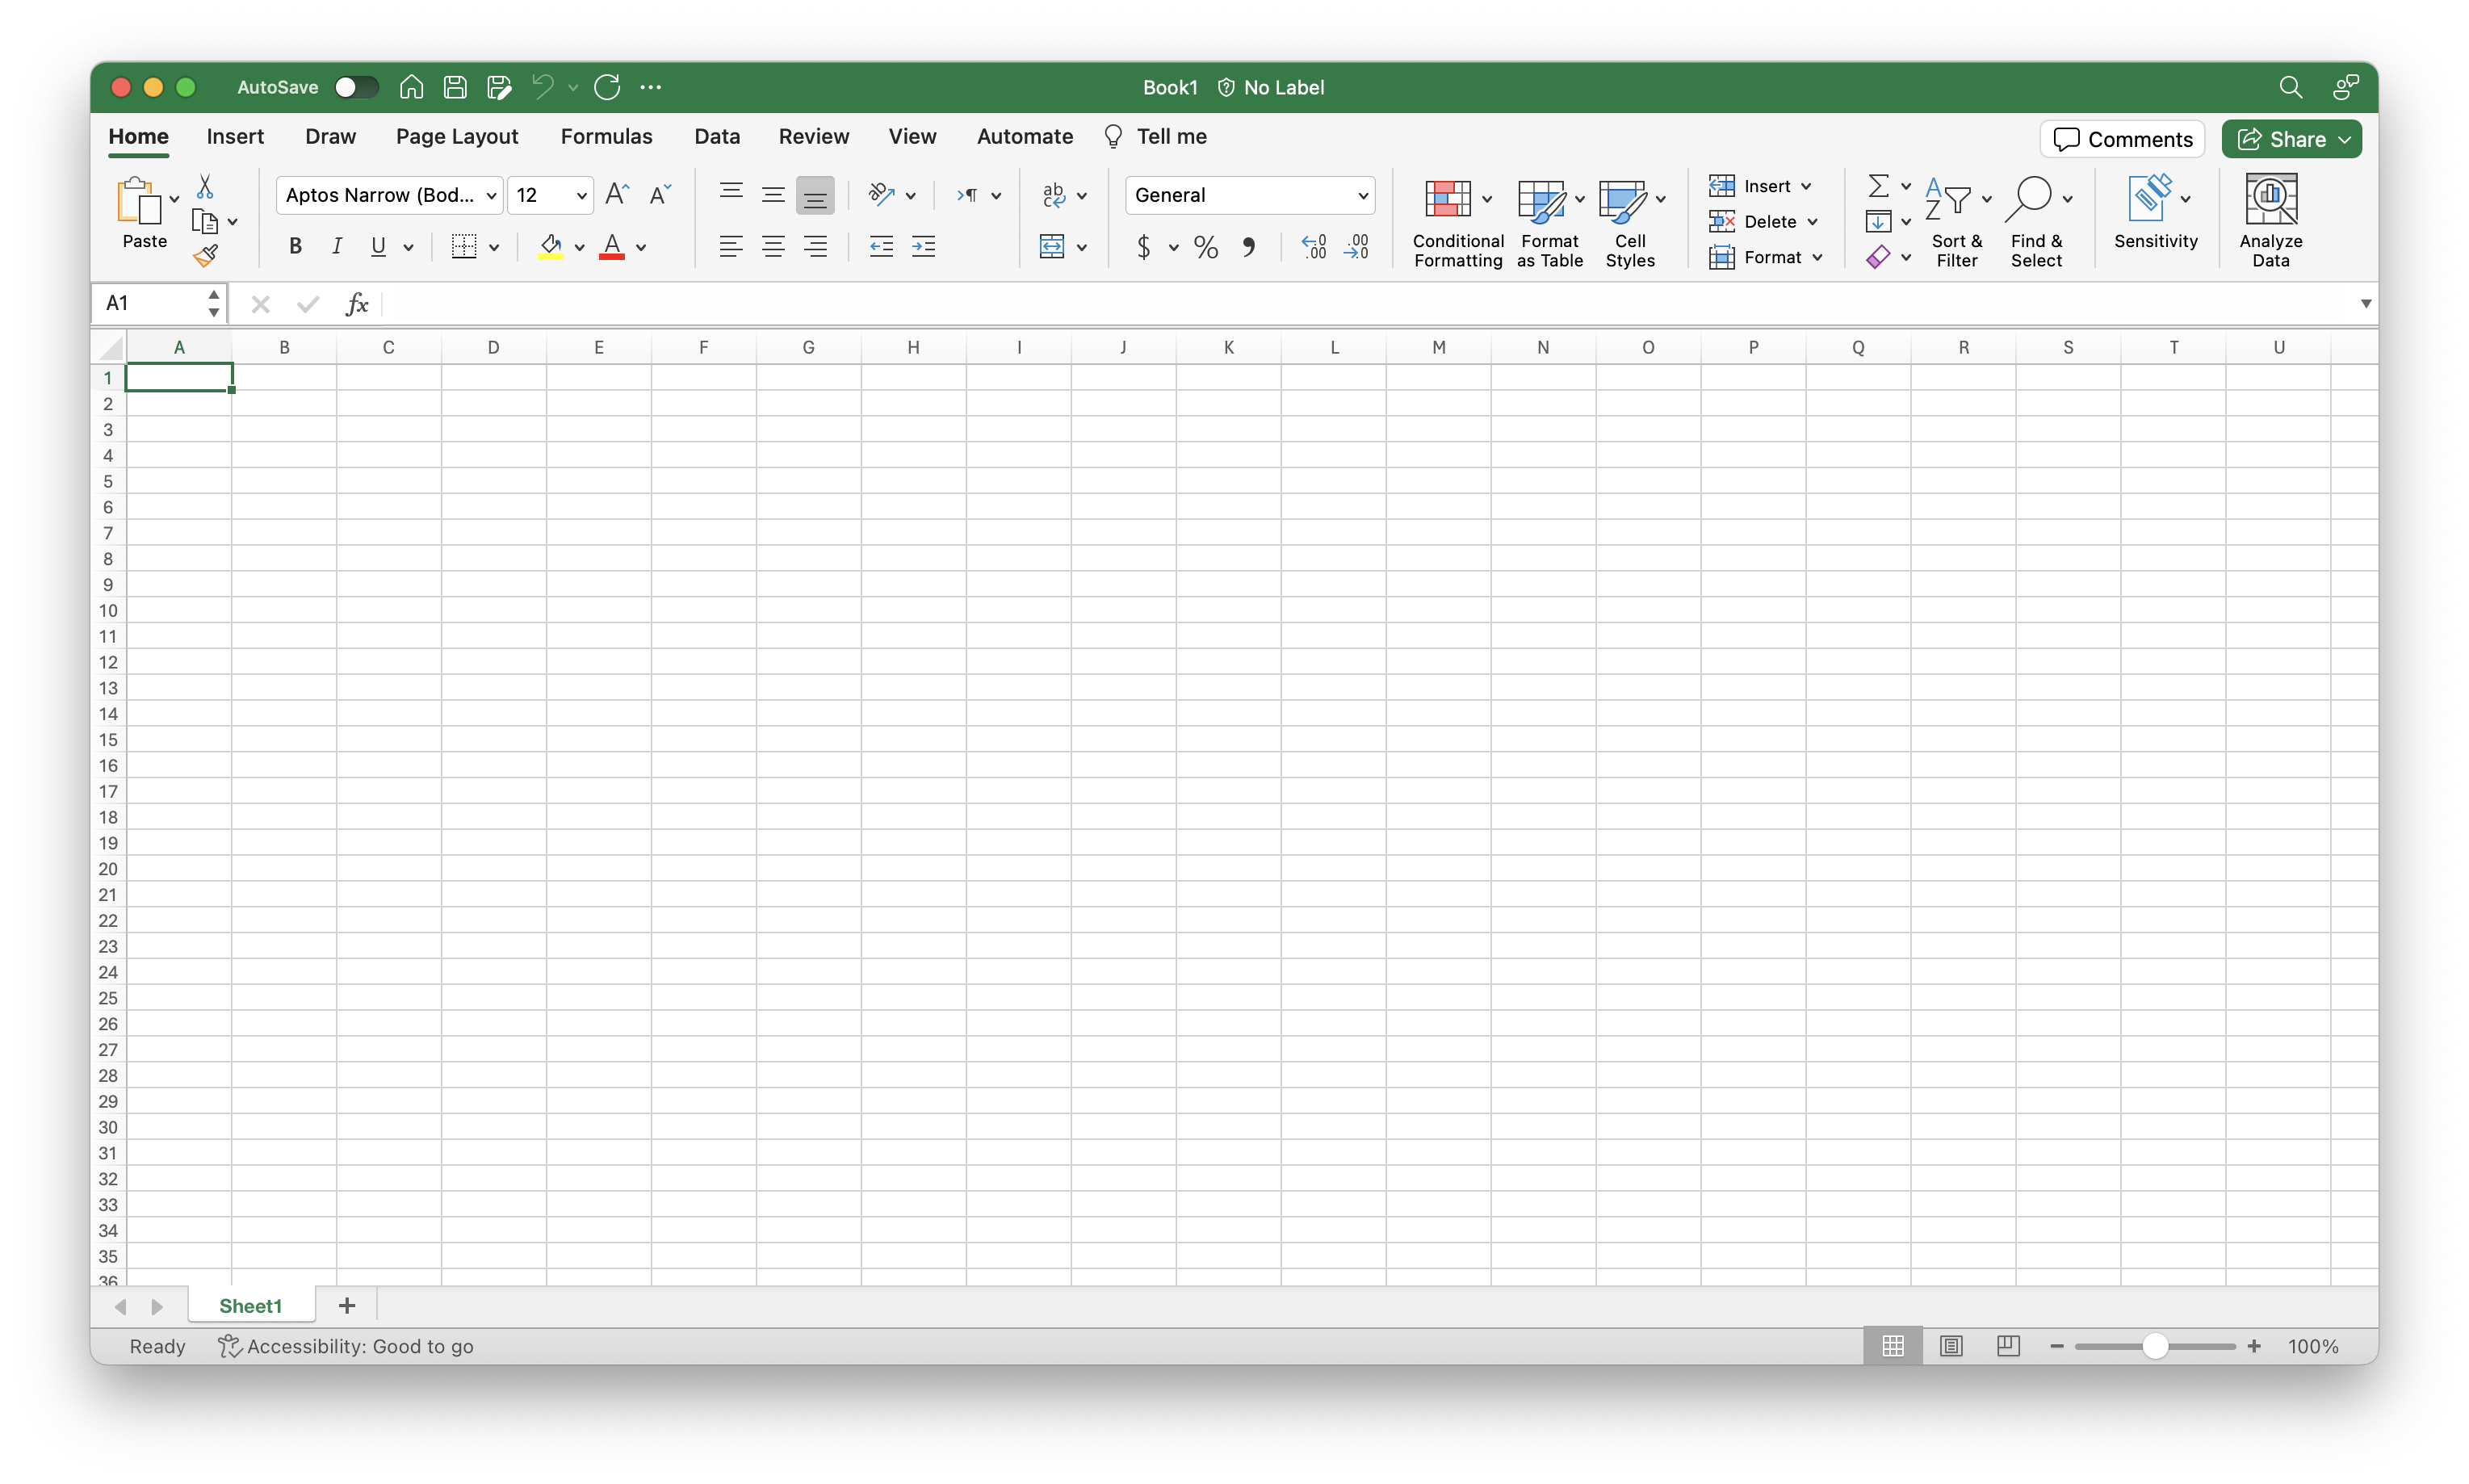
There is a lot to take in on the screen, but don’t get too stressed out! We are going to tackle each component one at a time.
Note, my Excel window may look slightly different than yours. The layout should be similar, but please ask questions if something doesn’t look right!
Excel has columns and rows, displaying data in a tabular format.
Rows are indicated with numbers and columns are indicated with letters.
Each rectangle is a cell and is associated with a column, row index.
For instance, the first cell in the workbook is column A, row 1. This
would be expressed as A1.
Layout
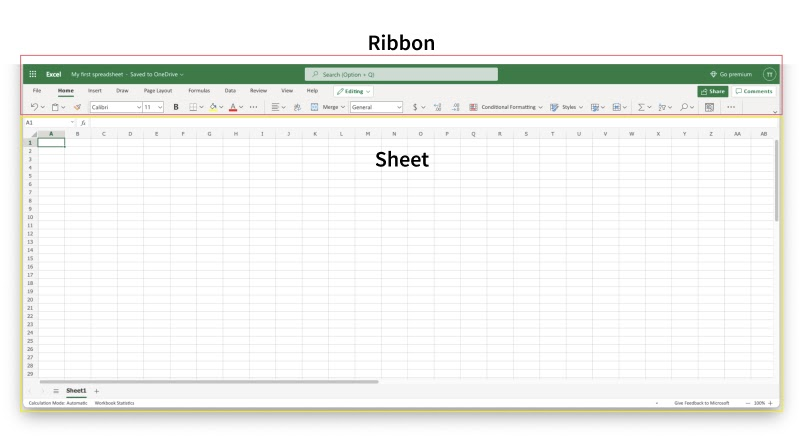
Excel is composed of two main parts- a Ribbon and a Sheet.
The Ribbon
The Ribbon provides shortcuts to Excel commands. A command is an action that allows you to make something happen. This can for example be to: insert a table, change the font size, or to change the color of a cell.
It may seem overwhelming at first, but don’t worry- you will soon be able to navigate it with ease! There are certain commands that you will use more than others and can focus your mental efforts on finding.
The Ribbon is made up by the App launcher, Tabs, Groups and Commands.
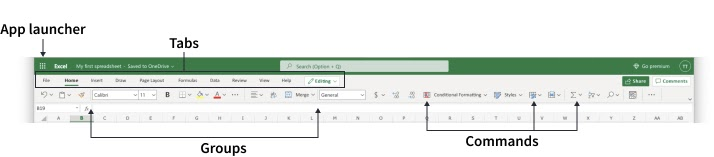
App launcher
The App launcher icon has nine dots and is called the Office 365 navigation bar. It allows you to access the different parts of the Office 365 suite, such as Word, PowerPoint and Outlook. App launcher can be used to switch seamlessly between the Office 365 applications.
Tabs
The tab is a menu with sub divisions sorted into groups. The tabs allow users to quickly navigate between options of menus which display different groups of functionality.
Groups
The groups are sets of related commands. The groups are separated by the thin vertical line break.
Commands
The commands are the buttons that you use to do actions.
The Sheet
The Sheet is a set of rows and columns. Values can be typed to cells and can be both numbers and letters:
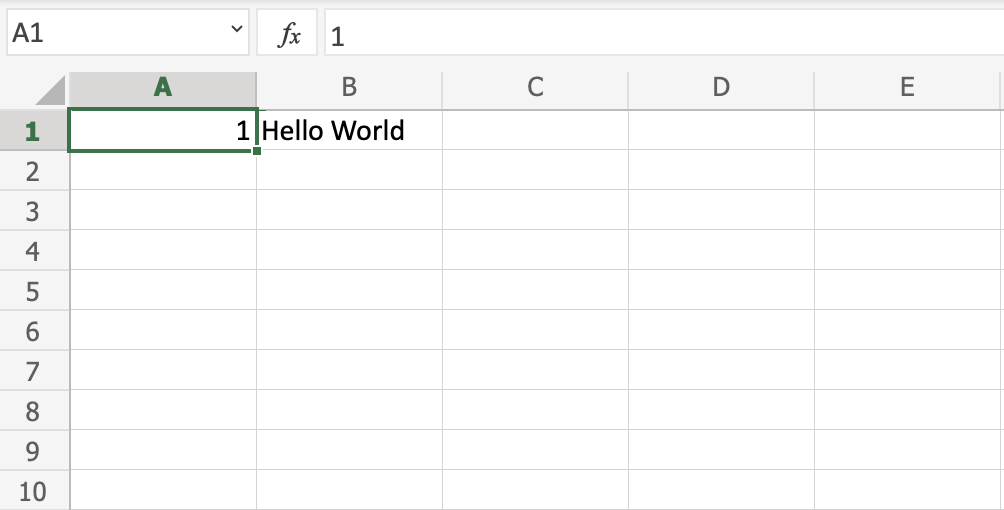
Can you guess the index of the cell that “Hello World” was typed in?
If you’re unsure, you can click on the cell and look at the Name Box just above the A column.
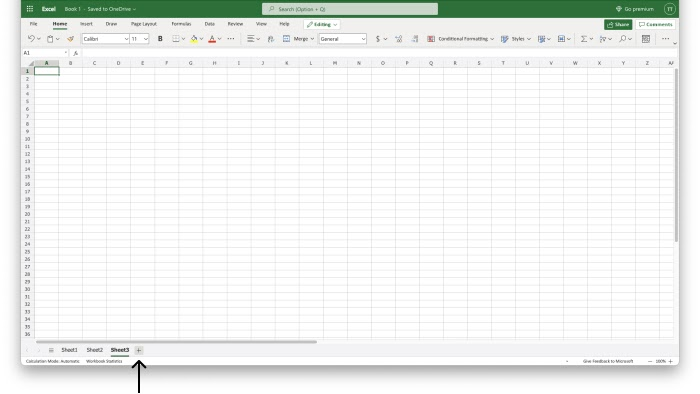
Multiple sheets
You aren’t limited to a single sheet in your workbook! To add a new sheet, you can click the plus icon next to the “Sheet#” tab, where “#” is the number of the last sheet you created.
It’s often helpful to rename your sheets to something more useful. To do
this, right-click (or Ctrl-click) and select “Rename” from the pop-up
menu. Enter your desired name and click “OK”.
**Try it out:
**Try adding a new sheet, then renaming the two sheets to whatever you
would like!
Excel materials inspired or sourced from W3Schools. Lab materials inspired by Data Nuggets.